XAGUSD Elliott Wave: Silver Coils Under $83.05 Wall
The correction is almost done. The structure shows us exactly where to look.
Silver just finished a wild ride from $122 down to $61, and now it's parked itself right below $83.05. That level is not random. It's the invalidation for the entire bearish count, and price stalling right underneath it is exactly the kind of setup that gets ignored by traders chasing the bounce.
Below $83.05, the bearish structure stays alive. If price pushes higher than that, the whole count breaks and the bullish case takes over. That's the line in the sand. Everything else is noise until that number gets touched or respected.
What does the wave count on XAGUSD actually show?
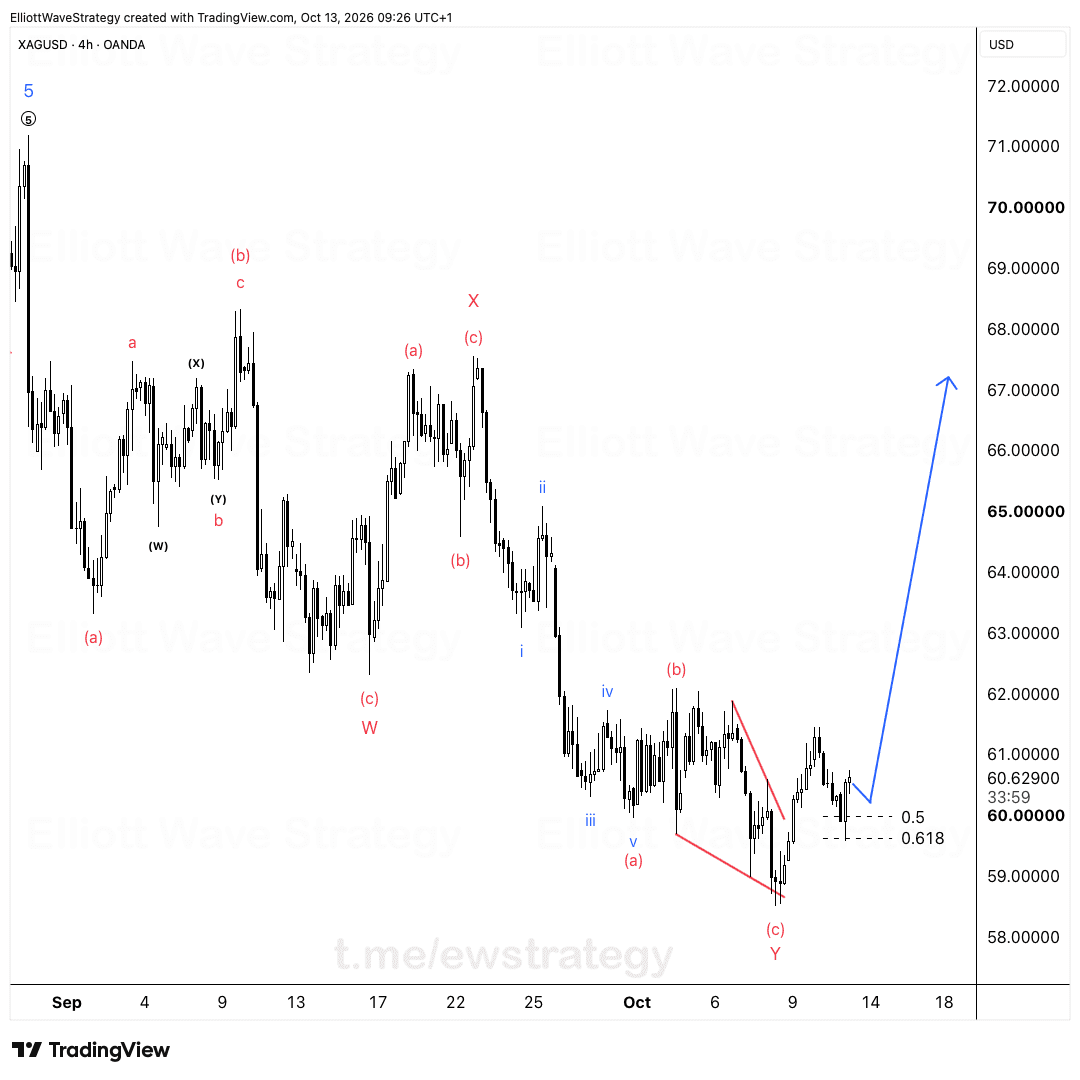
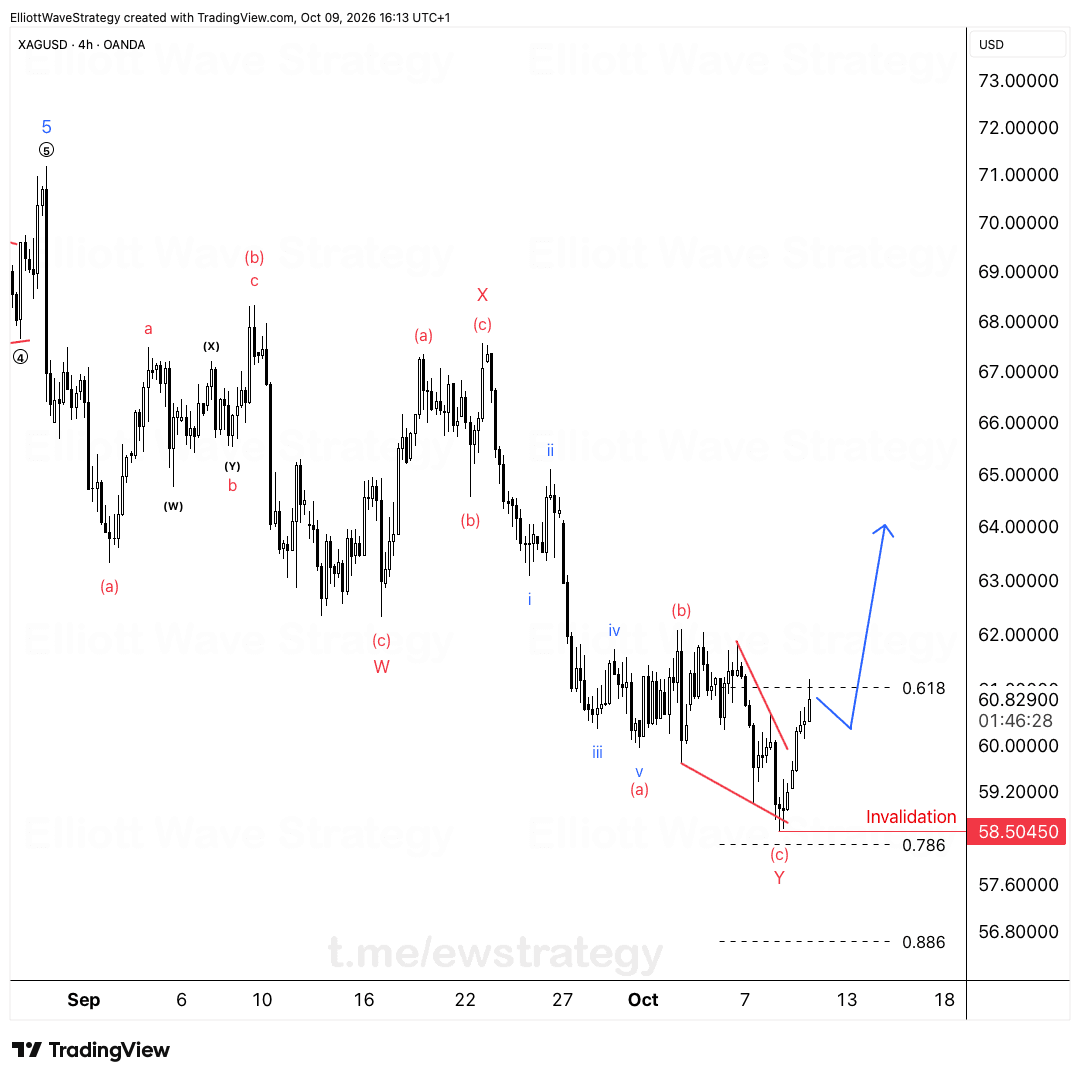
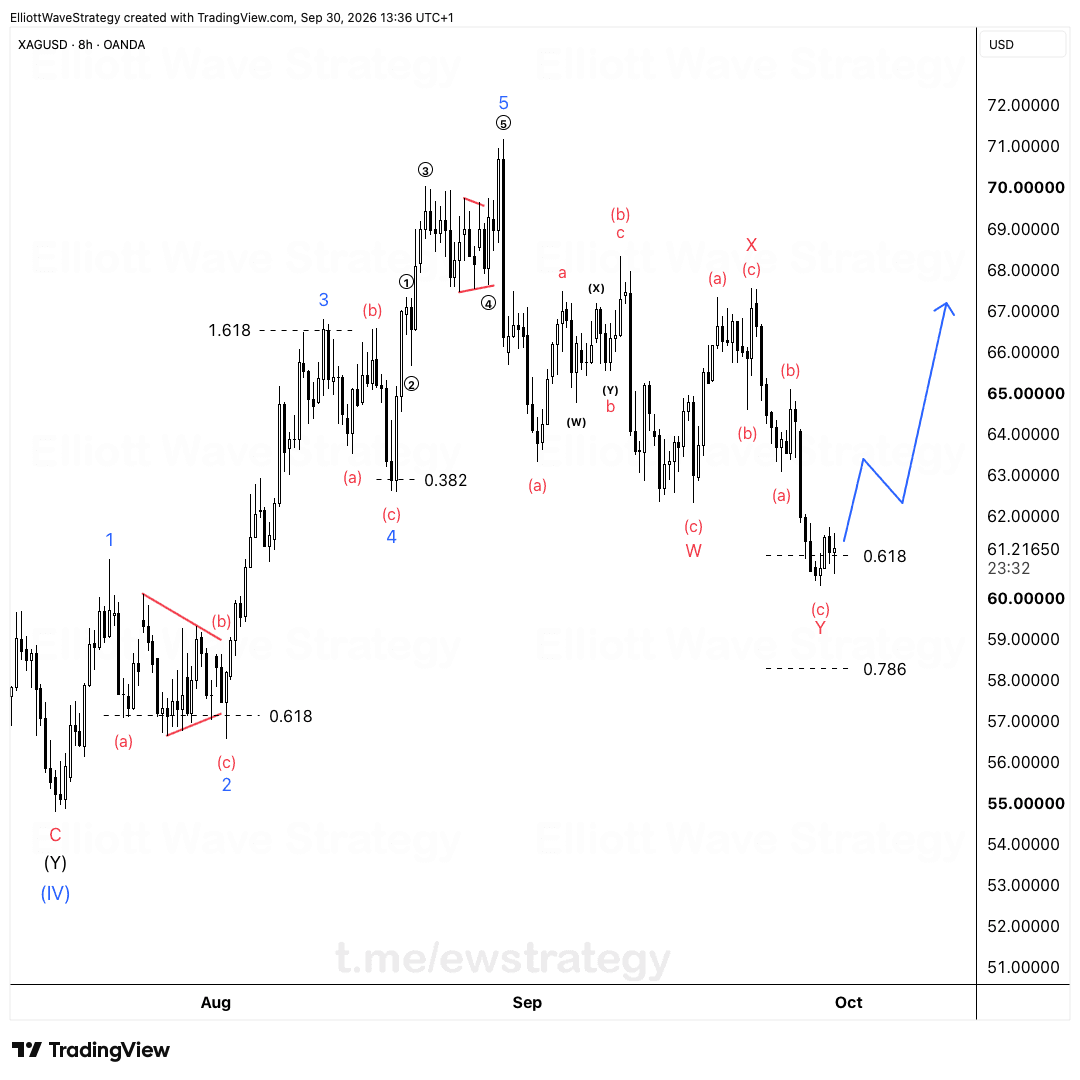
Zoom into the chart and you can trace the whole story. The move down from $122 unfolded as a W-X-Y correction, bottoming near $61 in what's labeled wave C of Y. From there, silver built a five-wave advance inside an ending diagonal structure, with waves 1 through 5 visible climbing out of that low along the dotted trendline.
Wave 5 of that diagonal is sitting right at the current price, just under the $83.05 ceiling. Above it, Cetin has marked a possible X wave, meaning this whole leg up could just be a corrective bounce inside a bigger bearish picture, not the start of a new bull run.
Why does $83.05 matter more than the current bounce?
Most traders watching silver right now see a rally off the lows and want to buy the recovery. That's the trap. A bounce after a violent multi-month decline always looks tempting, but the structure says this is corrective, not impulsive.
The expected path is a small push higher first, maybe a marginal new high, then a rejection. That rejection candle is the trigger everyone chasing the bounce will miss because they're too busy celebrating the recovery.
$83.05 is the invalidation. Above it, the bearish count is dead and a fresh bullish structure needs to be considered. Below it, the setup for a drop toward $68 stays on the table.
What's the downside target if the rejection plays out?
The measured target sits around the $68 zone. From current levels near $80, that's over 1000 pips of potential downside if the rejection at or near $83.05 confirms.
This lines up with prior support built during the wave 2 and wave 4 pullbacks of the diagonal, giving the $68 area technical weight beyond just wave counting.
How should traders think about a setup that isn't guaranteed?
No count is 100%, and this one isn't either. What makes it tradeable isn't certainty, it's clarity: the failure point is $83.05, the target is $68. Two numbers, one plan.
The traders who lose money here are the ones who see the bounce, get excited, and buy without asking what invalidates their idea. Plan first, then react to what the market actually gives you.
Silver's next few sessions will tell the story. A clean break above $83.05 kills the bearish case. A rejection below it opens the door toward $68.
Key Takeaways
- •XAGUSD is trading just below the $83.05 invalidation level after a decline from $122 to $61.
- •The bearish Elliott Wave count on XAGUSD stays valid as long as price holds under $83.05.
- •A small push higher followed by a rejection candle is the expected path before any drop toward $68.
- •The downside target on XAGUSD sits near $68, representing over 1000 pips of potential move.
- •Wave 5 of an ending diagonal appears complete on silver, with a possible X wave forming just under invalidation.
Frequently Asked Questions
What invalidates the bearish XAGUSD count?
A confirmed move above $83.05 invalidates the bearish structure and would require reassessing the count as bullish rather than corrective.
What is the downside target for silver in this Elliott Wave count?
The measured target sits around the $68 zone, based on the prior wave structure and the diagonal's support levels.
Why isn't the current silver rally considered bullish?
The rally is labeled as a corrective wave, possibly an X wave, inside a larger bearish sequence, meaning it's expected to fail rather than continue.
Disclaimer: This analysis is for educational purposes only and does not constitute financial advice. Elliott Wave analysis involves subjective interpretation. Always do your own research and manage your risk accordingly.
Get Full Coverage for All 27 Instruments
Premium members receive daily wave counts with entry zones, targets and invalidation levels, published daily across all 27 instruments.
View Premium Plans