XAGUSD Elliott Wave: W-X-Y Correction Done, $64 Next?
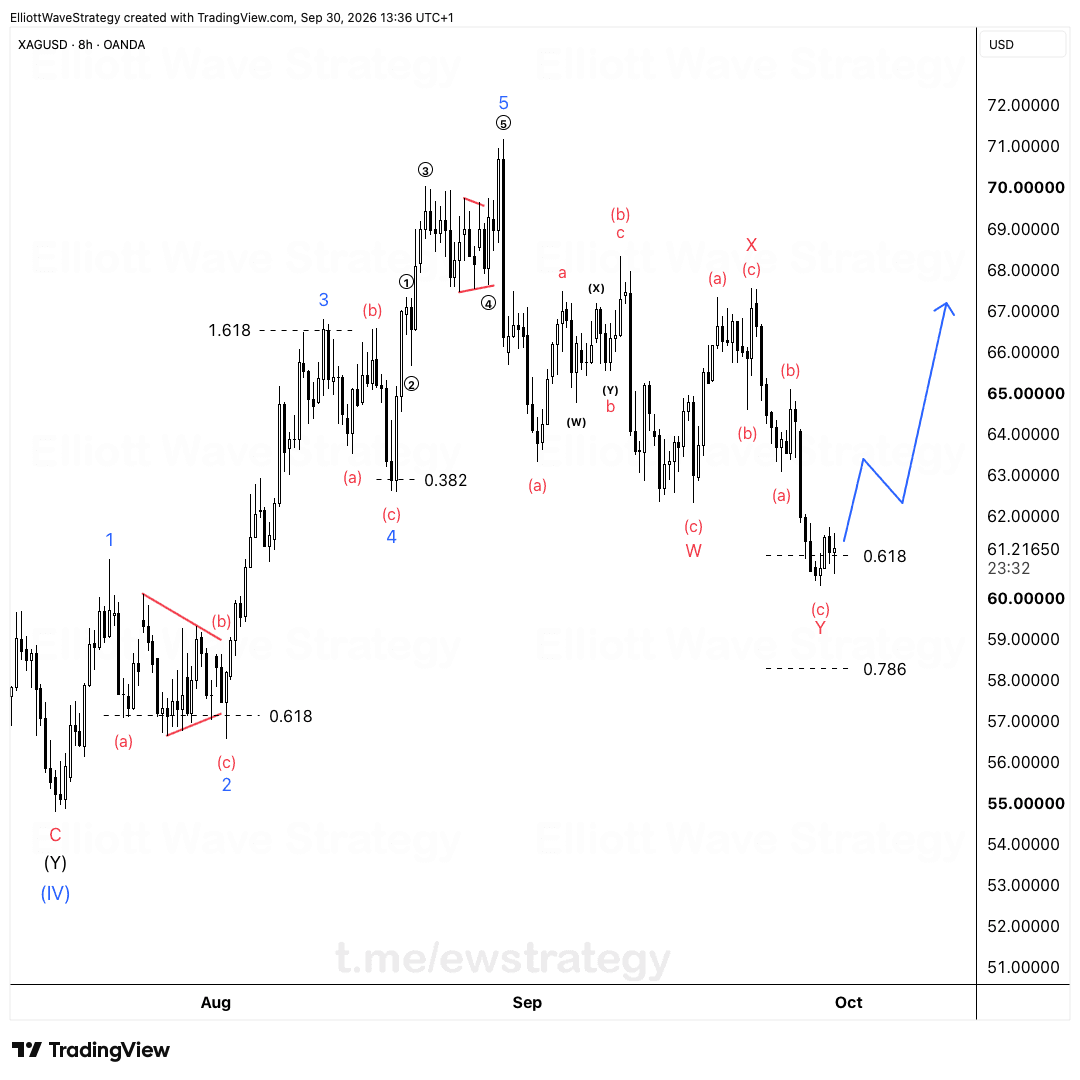
The correction ran deeper than I expected in our last update. Wave (c) of Y ended just above the 0.786 area, and price is now slowly curling back up.
The correction in silver ran deeper than I expected in my last update. Wave (c) of Y ended just above the 0.786 area, and price is now slowly curling back up.
It has also broken above the falling trendline, so this W-X-Y may be done. I want a pullback first, then another push toward $64.
What is the current Elliott Wave count on XAGUSD?
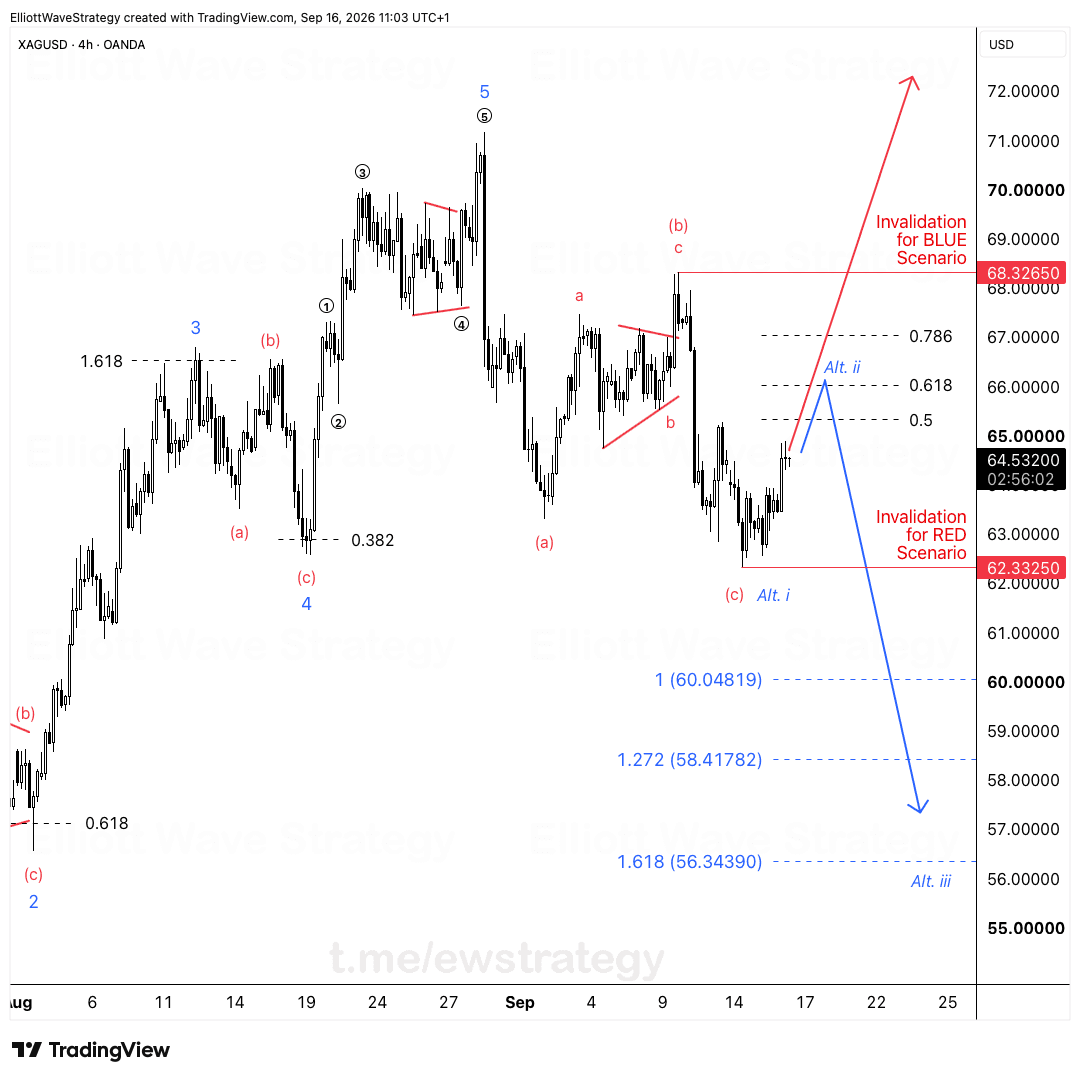
The 4h chart shows a double zigzag correction after the wave 5 high near $71. Wave W finished with its (c) leg around the mid-$62 area. Wave X retraced up into the high $67s. Wave Y then took price lower in an (a)-(b)-(c) structure.
Wave (c) of Y is the final leg of that sequence. Inside it, the chart shows a clean five-wave decline: i, ii, iii, iv, v, with wave (a) labeled at the v low and (b) bouncing to roughly $62. The last leg down then drove price into the lows, where it formed a wedge-like squeeze against the falling red trendline.
Where did the XAGUSD correction end?
Wave (c) of Y bottomed at $58.50, just above the 0.786 retracement. I had expected a shallower correction, so this one went deeper than planned. That happens. The count does not need to be perfect on the first pass, it needs to stay valid.
The 0.786 level sits at roughly $58.20 on the chart, with the 0.886 further down near $56.80. Price never reached either. A deep correction that holds above the 0.786 is still a normal corrective retracement of the prior advance.
What confirms that the W-X-Y is finished?
Two things matter here. First, price is curling higher after the wave (c) low, with a slow, grinding recovery rather than a vertical spike. Second, it has broken above the falling trendline drawn across the wave (c) decline.
That trendline break is the first real evidence the downward sequence is exhausted. It is not proof. It is a reason to treat the bullish count as the primary scenario and watch how the next pullback behaves.
What is the next move for silver?
I want a pullback first, then another push toward $64. The blue arrow on the chart shows exactly that path: a dip back toward the $60 to $60.50 region, then a rally into the mid-$60s.
The 0.618 level sits near $61 and is the first obstacle on the way up. A pullback that holds above the $58.50 low keeps the count intact. A new high above $64 would confirm that the correction is behind us and a new advance is underway.
What invalidates this XAGUSD count?
A break below $58.50 kills this count. No reinterpretation, no hoping. If price trades under that low, wave (c) of Y was not the end and the correction extends, with the 0.886 area near $56.80 becoming the next reference.
A defined invalidation is the whole point of working with a wave count. It tells you when the idea is wrong instead of letting you argue with the market.
This is analysis, not a trade signal. For how corrective structures like this one are built and why they run deep, the commodities pillar covers silver and gold in detail.
Key Takeaways
- •XAGUSD completed wave (c) of Y just above the 0.786 retracement, with the correction low at $58.50.
- •The Elliott Wave count on XAGUSD is a W-X-Y double zigzag that may now be complete after a break above the falling trendline.
- •XAGUSD is expected to pull back first and then push toward $64 if the $58.50 low holds.
- •A break below $58.50 invalidates the bullish XAGUSD count and keeps the correction alive toward the 0.886 area near $56.80.
Frequently Asked Questions
What invalidates the bullish XAGUSD Elliott Wave count?
A break below $58.50, the low of wave (c) of Y. Under that level the W-X-Y correction is not finished and price can extend toward the 0.886 retracement near $56.80.
Where is silver headed after the W-X-Y correction?
The primary scenario is a pullback first, then another push toward $64. The first resistance on the way up is the 0.618 level near $61.
Why did the silver correction go deeper than expected?
Wave (c) of Y extended down to just above the 0.786 retracement. Deep corrections are normal in a double zigzag, and the count stays valid as long as $58.50 holds.
Disclaimer: This analysis is for educational purposes only and does not constitute financial advice. Elliott Wave analysis involves subjective interpretation. Always do your own research and manage your risk accordingly.
Get Full Coverage for All 27 Instruments
Premium members receive daily wave counts with entry zones, targets and invalidation levels, published daily across all 27 instruments.
View Premium Plans