Gold Elliott Wave: X Wave Holds, Invalidation at 4,890
Last week we said the X wave was complete.
Last week we said the X wave in gold was complete. The invalidation was 4,890.967. Price never touched it. Gold is now trading at 4,709.
That is the whole update. No drama, no new count, no reason to touch anything.
Why does invalidation matter more than the forecast itself
A wave count is not a prediction. It is a map. Every map has a point where you know you took the wrong road, and in Elliott Wave work that point is called the invalidation level.
Without it, you are gambling. You are just staring at candles and hoping.
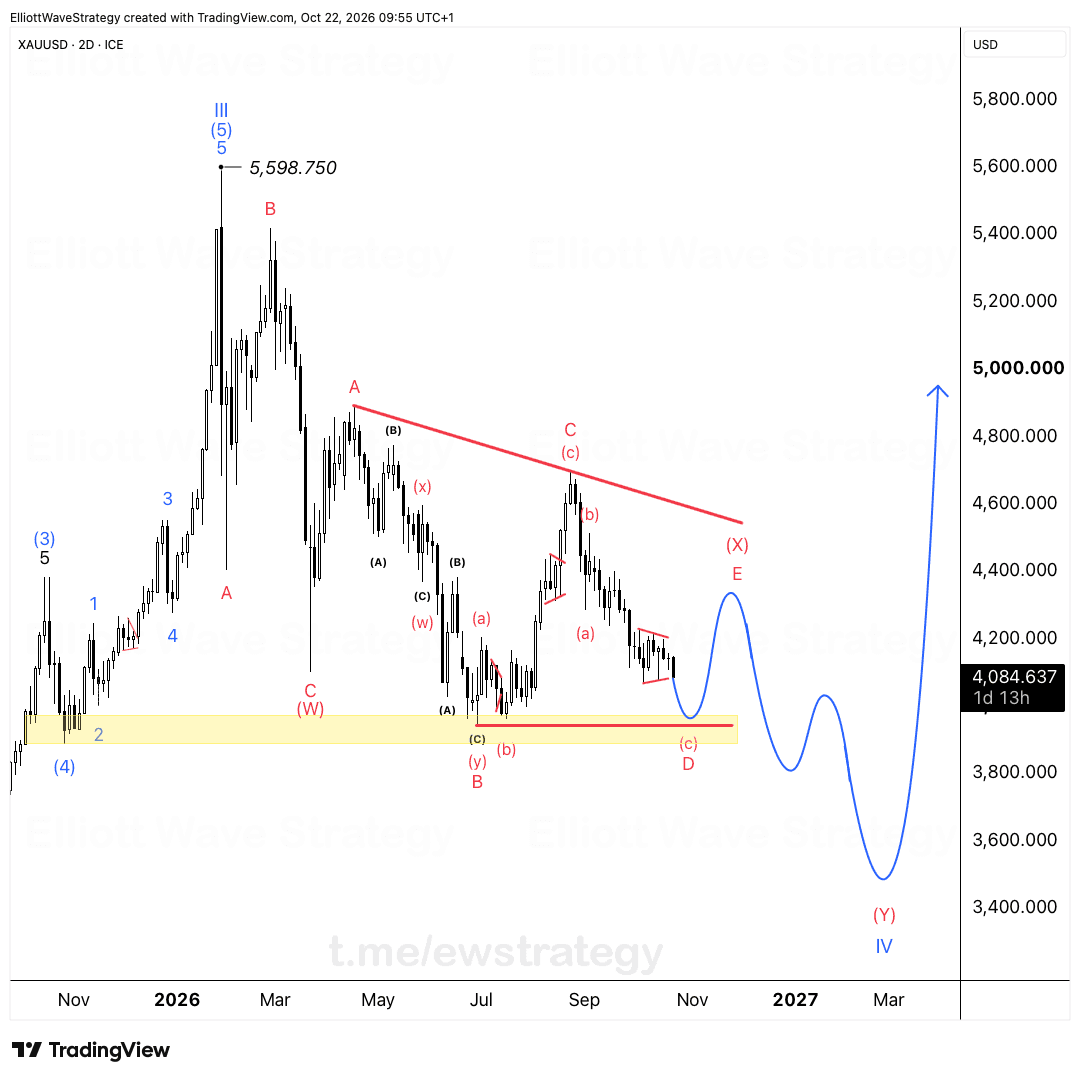
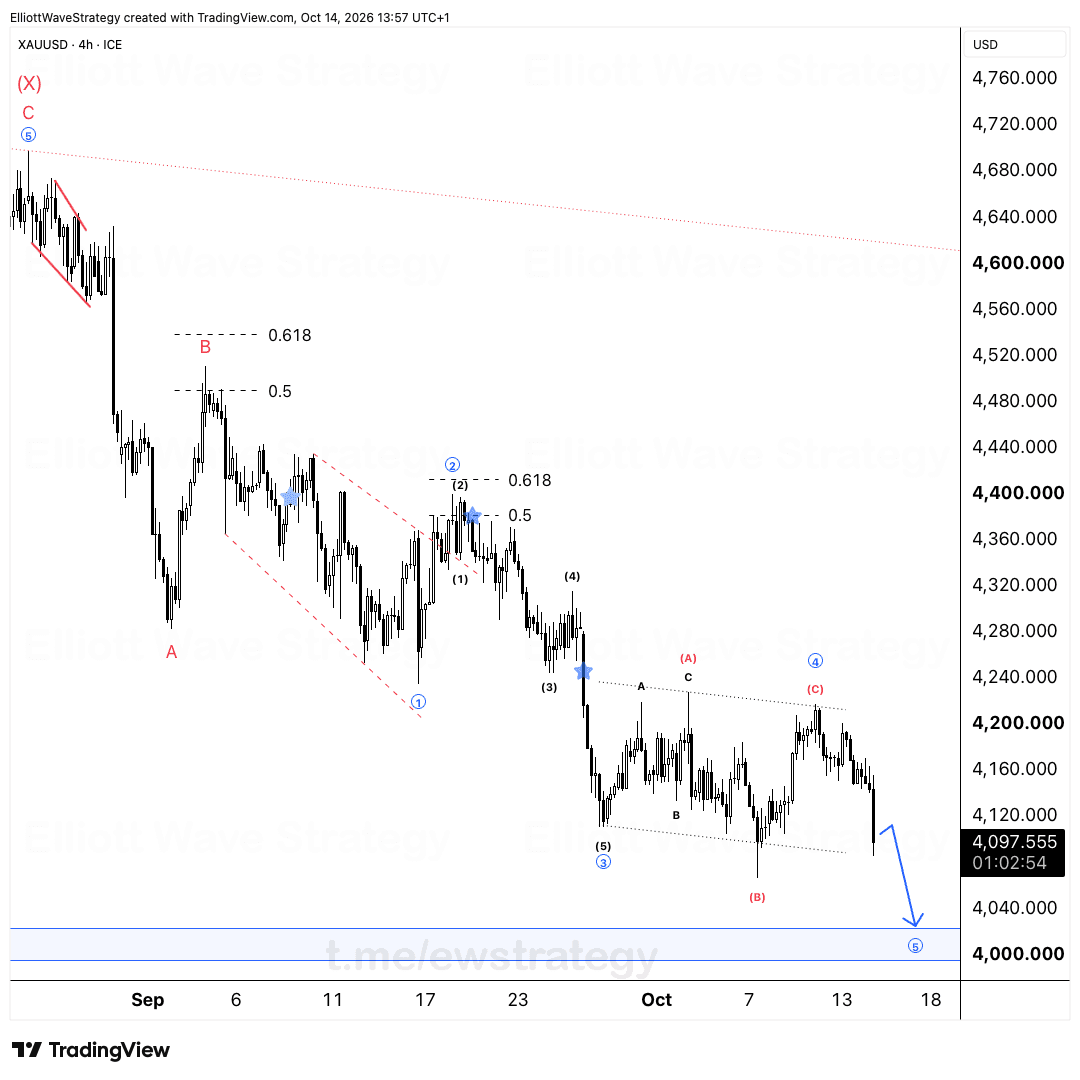
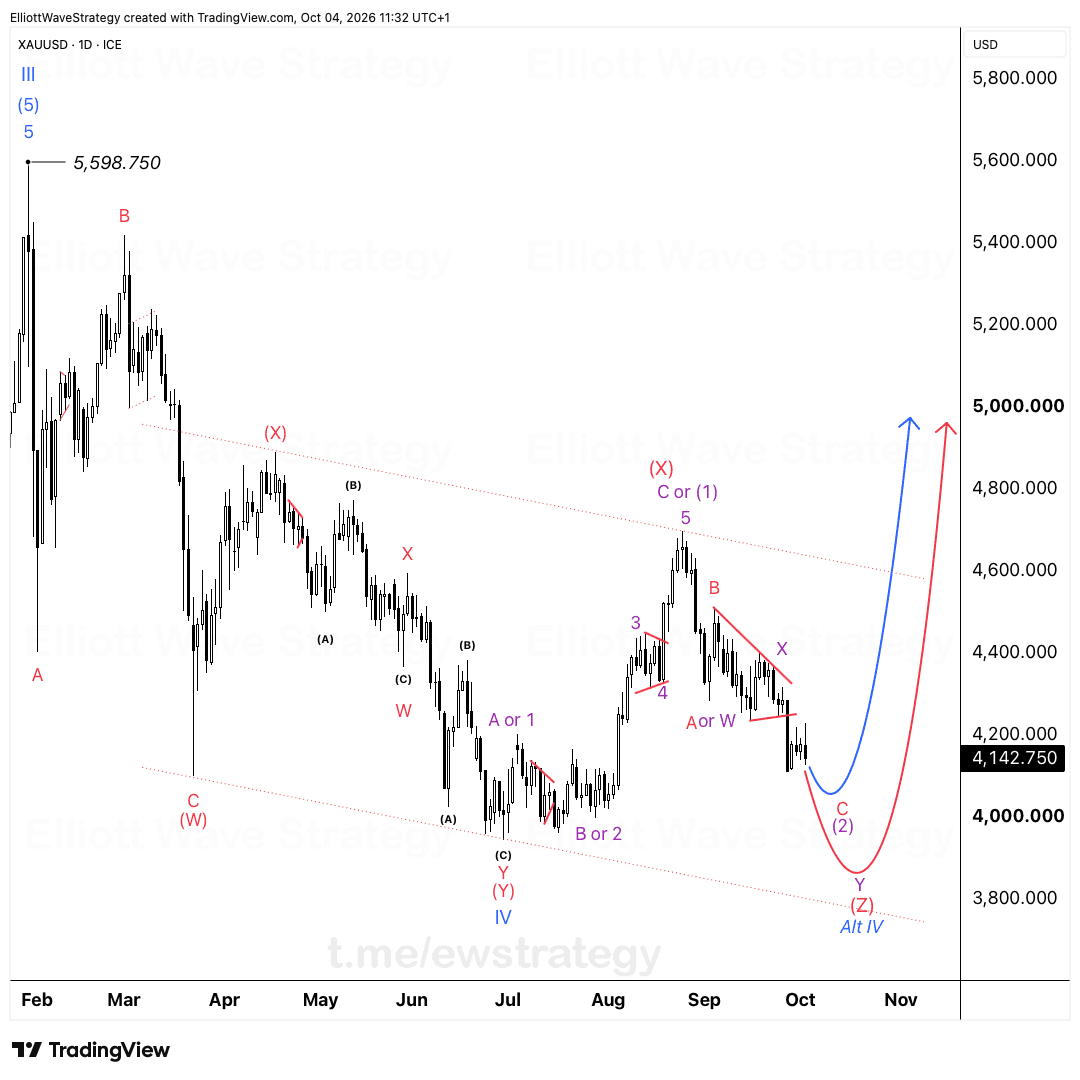
On the XAUUSD 4h chart, the X wave topped out with a C leg near 4,920 inside a (Z) label, capping a W-X-Y-X-Z corrective sequence off the March high. As long as price stays below 4,890.967, that corrective structure is intact and the roadmap toward the drawn downside target remains valid.
What the chart is actually showing right now
Gold pushed up into the 4,890.967 zone and rejected. It never traded through it. Since then price has drifted down to 4,709, tracing what looks like the early stages of the move the chart projects lower, the blue arrow curling down toward the 4,300 to 4,270 region.
The corrective labeling on the left side of the chart, running from the (1) through (5) impulse down into the W-X-Y-X-Z complex, is doing exactly what it was built to do: define where the count breaks if wrong, and let price prove or disprove it without guesswork.
How professional traders read this differently than everyone else
While amateur traders panic about daily noise, the check is simple: did price hit invalidation? No? Then the plan remains active.
The structure is unfolding exactly as mapped. No emotions, no second-guessing, just following the roadmap until the market itself says otherwise.
This is the discipline that separates a wave count from a hunch. You define the level that kills the idea before you ever look at the chart again, and you let that level do the work instead of your gut.
What would change this gold outlook
A close through 4,890.967 would break the current X wave labeling and force a re-map. Until that happens, the bias stays down from here, consistent with the trajectory already drawn on the chart.
Clear counts, clear invalidation, clear bias. That is the entire method, applied the same way every single day regardless of what gold does in between.
This is what daily gold coverage looks like: a level to watch, a reason for it, and no noise in between.
Key Takeaways
- •XAUUSD's X wave completed without ever touching the 4,890.967 invalidation level.
- •Gold has pulled back to 4,709 while the corrective wave count from the March high stays intact.
- •The Elliott Wave map for XAUUSD projects a decline toward the 4,300 to 4,270 region if invalidation holds.
- •A confirmed close above 4,890.967 would invalidate the current gold count and require a re-map.
- •Following invalidation levels rather than reacting to daily price noise is the core discipline behind this gold analysis.
Frequently Asked Questions
What invalidates the current XAUUSD Elliott Wave count?
A sustained move above 4,890.967 would invalidate the X wave labeling on the gold chart and require the count to be reassessed.
Why did gold pull back after reaching the X wave high?
Price rejected near the 4,890.967 invalidation zone without touching it, which kept the corrective W-X-Y-X-Z structure valid and opened the path lower toward 4,709 and beyond.
Is this gold analysis a buy or sell signal?
No. It is a structural map showing where the current Elliott Wave count in XAUUSD would be proven wrong, not a trade recommendation.
Disclaimer: This analysis is for educational purposes only and does not constitute financial advice. Elliott Wave analysis involves subjective interpretation. Always do your own research and manage your risk accordingly.
Get Full Coverage for All 27 Instruments
Premium members receive daily wave counts with entry zones, targets and invalidation levels, published daily across all 27 instruments.
View Premium Plans