Gold Elliott Wave: Wave IV Correction Targets $3,183-$3,637
The gold bull market is alive and well. But you need to wait.
Gold is not crashing. Gold is correcting. There is a difference, and most traders will get it wrong over the next few months.
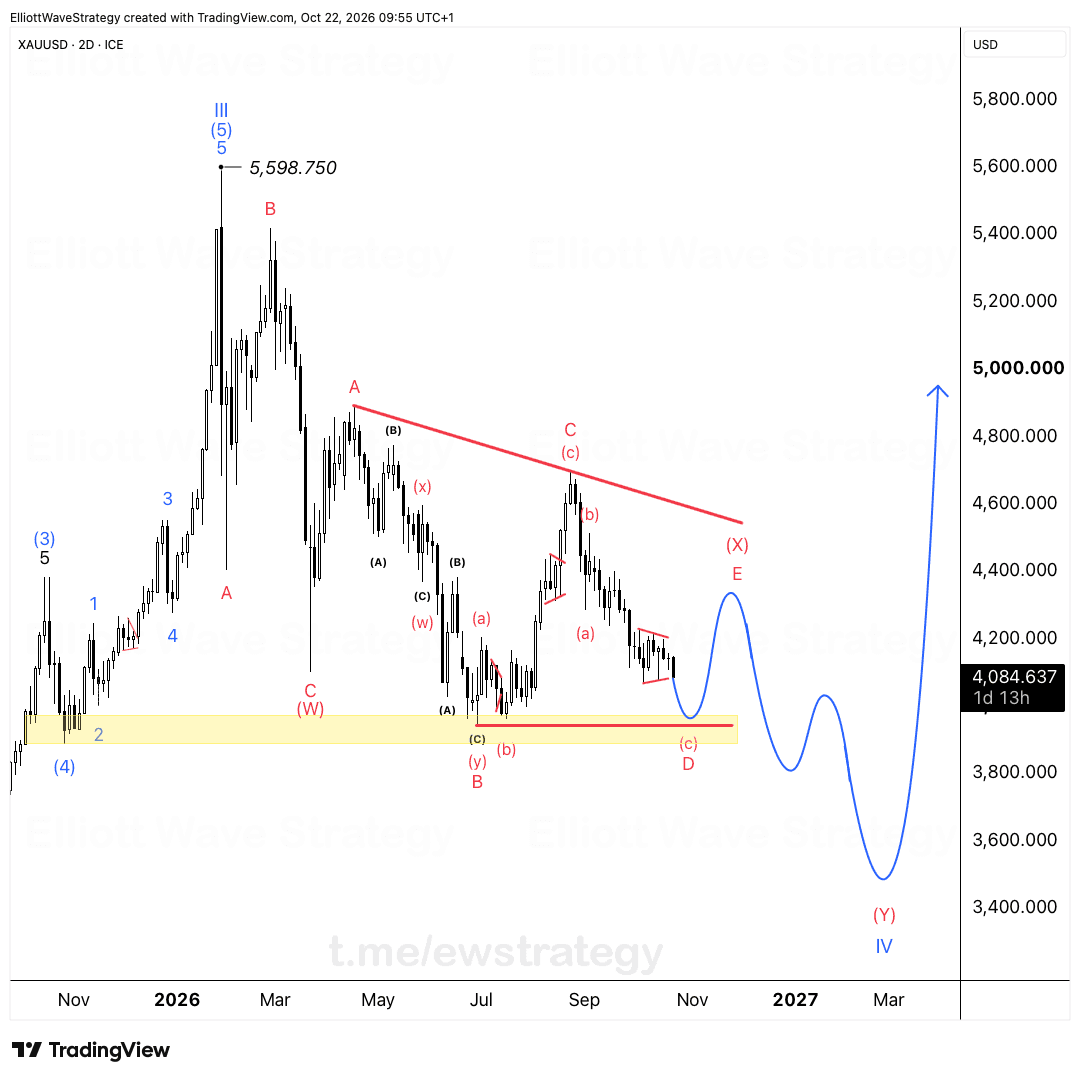
Wave III just finished its rally at the highs on the weekly chart. That was the (5) of III, the top of a massive five wave advance that started years ago. Now price is pulling back into Wave IV. This is not the end of the bull market. This is the market catching its breath before Wave V.
What does the Wave IV structure look like on XAUUSD?
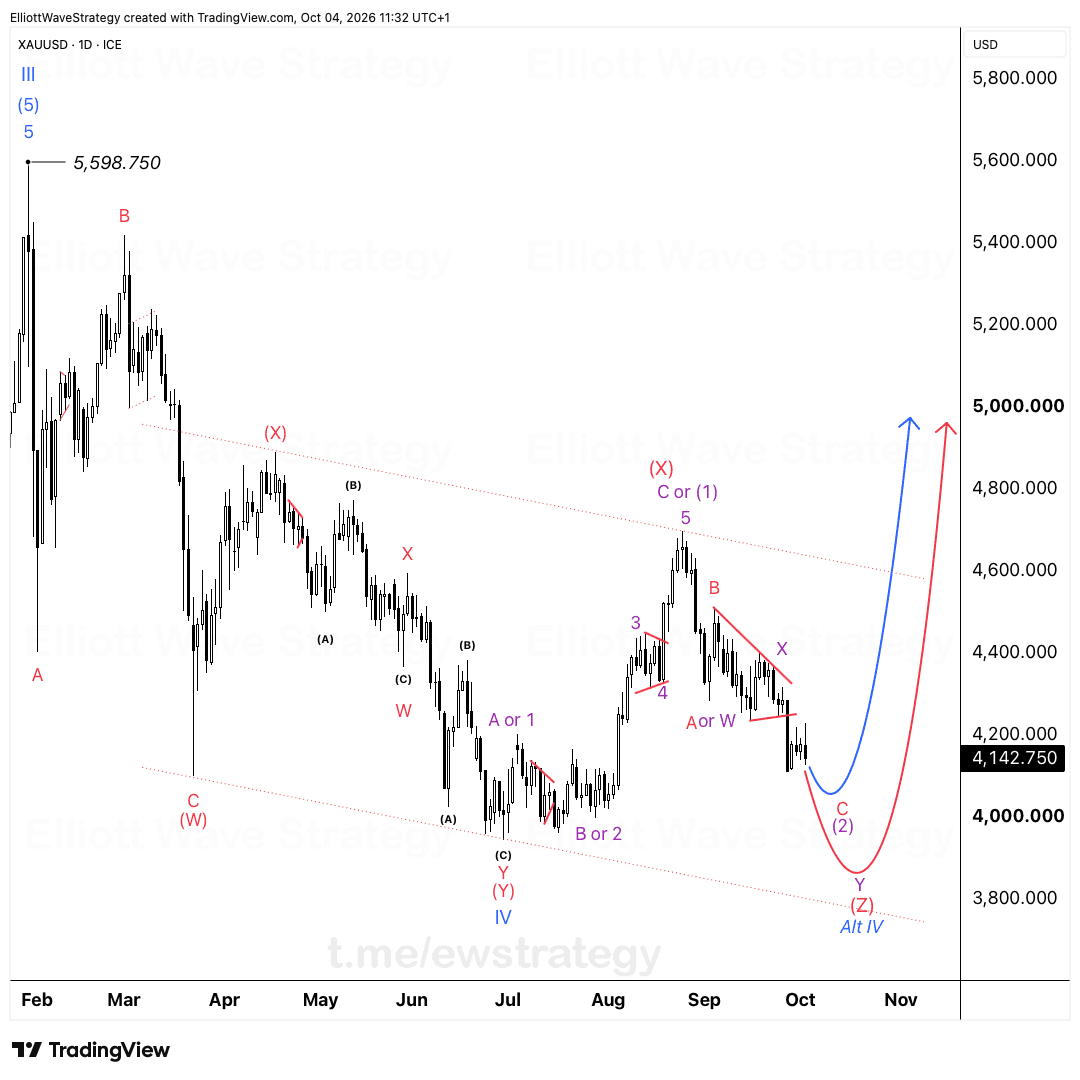
The chart shows a complex correction labeled W-X-Y. Wave (W) already completed. Wave (X) was the bounce that followed, and now we are inside Wave (Y), the final leg down of the correction.
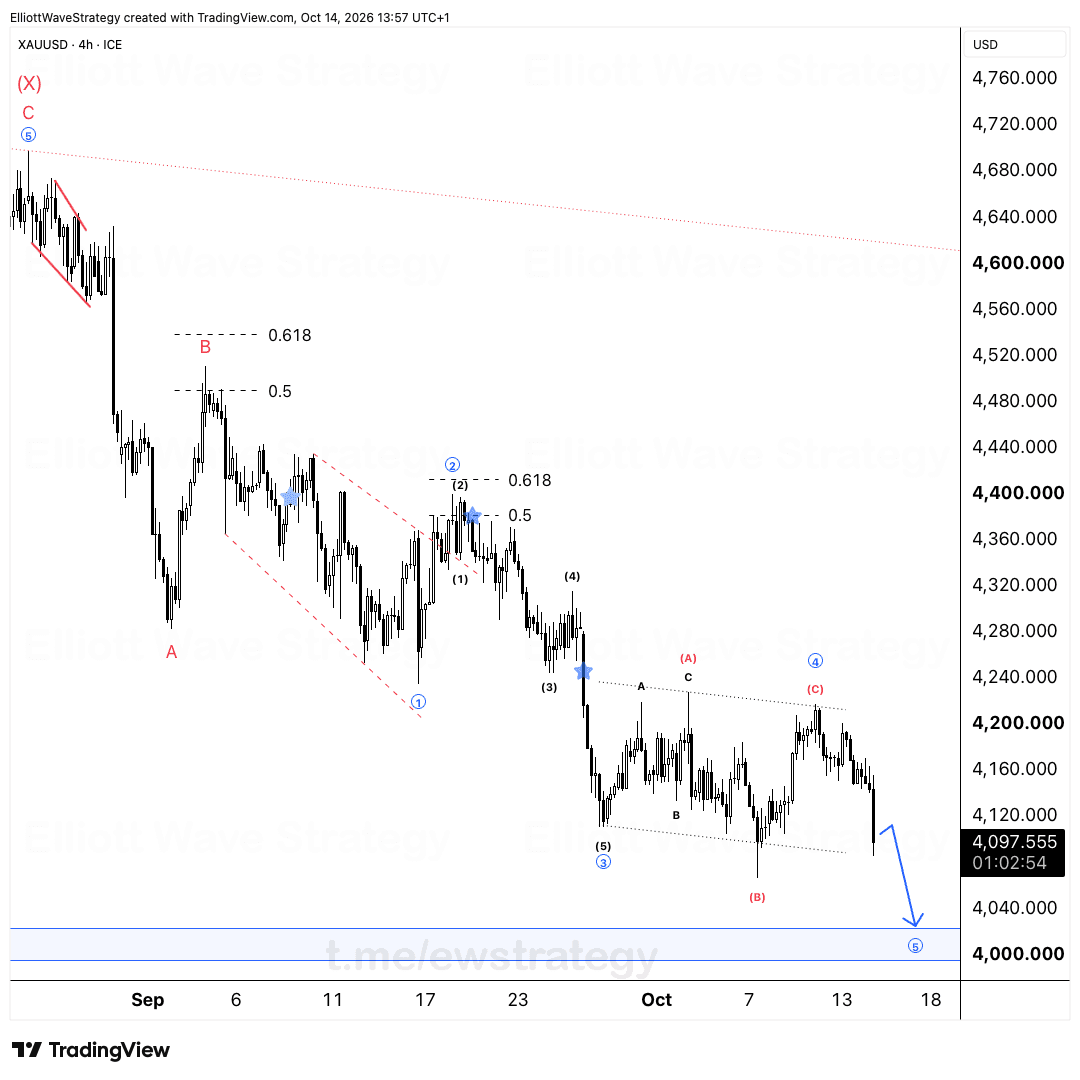
Inside that (Y) wave, the internal structure is A-B-C. Wave A and B are already printed on the chart. Wave C is the leg still in progress, and it's the one that will define where this correction actually ends.
Where is the Wave IV target zone for gold?
The chart marks two Fibonacci levels for the C wave of (Y): the 0.382 retracement at 3,637.531 and the 0.5 retracement at 3,183.863. Both are measured off the entire Wave III advance.
That 3,637 to 3,183 range is the zone where this correction is expected to find its floor. It's a wide range because Wave IV corrections don't hand you a precise number, they hand you a zone where the probability of completion increases sharply.
This lines up with how Elliott Wave theory treats fourth waves. They often retrace into the territory of the previous fourth wave of one lesser degree, and they tend to be sideways and complex rather than sharp and simple. The WXY count fits that pattern here.
Why do most traders panic during a Wave IV correction?
Because it feels like the trend is over. Price has been climbing for years, then suddenly it drops hard, and the emotional reaction is to sell into the weakness.
But Wave IV corrections happen precisely because the market needs to shake out weak hands before the final leg. Wave III was the strongest, most extended wave in the sequence, based on the labeling on this chart. Wave V still needs to happen, and that's usually the wave that makes the headlines.
Selling into the bottom of a fourth wave, right before the fifth wave starts, is one of the most common and costly mistakes in trading. The bigger the correction feels in real time, the more traders convince themselves the bull market is finished. Chart structure says otherwise here.
What invalidates this Wave IV count?
If gold pushes materially below the 0.5 retracement near 3,183.863 and starts producing a new impulsive structure to the downside instead of basing, the WXY count for Wave IV would need to be reconsidered. Until that happens, the pullback fits inside the corrective pattern shown on the chart.
The setup right now calls for patience, not action. Wave IV needs to finish its work in the 3,637 to 3,183 zone. Once that happens, the structure points to Wave V, the leg that Elliott Wave analysts watch for because fifth waves are where the biggest trending moves tend to show up.
Key Takeaways
- •XAUUSD completed Wave III and is now correcting inside Wave IV, not reversing the bull trend.
- •The Wave IV correction on XAUUSD is a complex WXY structure, with Wave C of (Y) still in progress.
- •The XAUUSD target zone for this correction sits between 3,637.531 and 3,183.863, based on 0.382 and 0.5 retracements of Wave III.
- •Selling into the bottom of a Wave IV correction is a common mistake traders make right before a Wave V rally.
- •Once Wave IV completes, the Elliott Wave count on XAUUSD points to a Wave V advance.
Frequently Asked Questions
What is the Wave IV target for XAUUSD?
The chart marks the 0.382 retracement at 3,637.531 and the 0.5 retracement at 3,183.863, measured from the full Wave III advance. This 3,637 to 3,183 range is the expected completion zone for Wave IV.
Is the gold bull market over after this drop?
No. The current decline is labeled as a Wave IV correction within an ongoing five wave impulse, meaning Wave V is still expected once the correction completes.
What invalidates the bearish Wave IV count on gold?
A sustained impulsive break well below the 0.5 retracement near 3,183.863 would call the current WXY correction count into question.
Disclaimer: This analysis is for educational purposes only and does not constitute financial advice. Elliott Wave analysis involves subjective interpretation. Always do your own research and manage your risk accordingly.
Get Full Coverage for All 27 Instruments
Premium members receive daily wave counts with entry zones, targets and invalidation levels, published daily across all 27 instruments.
View Premium Plans