
Contango, the Silent Cost in Oil and Gas
The futures curve is a cost structure, not a forecast. A modelled year of monthly rolls shows a correct 10% spot call finishing at -0.47%. Here is the arithmetic, and what it does to a multi-month
Quick answer: Contango means the futures curve slopes upward, so every contract you roll into costs more than the one you are leaving. That difference is not a fee and it never appears on a statement. It shows up as a slightly smaller position, month after month. In the model used throughout this article, a curve carrying 10.00% a year strips 9.52% of exposure over twelve rolls, which means spot has to gain 10.52% before a rolled long position is merely back where it started. Backwardation reverses the sign and pays you instead.
Most energy traders learn the futures curve as a sentiment indicator. Upward sloping means the market expects higher prices later, downward sloping means it expects lower ones, and both readings are wrong often enough to be dangerous.
The curve is a cost structure. It tells you what it costs to carry a barrel or a therm from today to a delivery date: the money you tie up, the tank you rent, the insurance you buy, less whatever benefit you get from actually having the physical commodity in hand rather than a promise of it. Every one of those inputs is observable. None of them is a forecast. And once you hold exposure through a rollover, you pay that cost structure or collect it, whichever way it points, regardless of what you think about direction.
What the curve is made of
Take a hypothetical energy commodity with spot set to 100.00 index units. Nothing here is a real contract and no number in this article belongs to one.
Price each delivery month as spot multiplied by the exponential of net carry times time to delivery. Net carry is three things added together:
- Financing. You are committing capital. Call it 5.00% a year.
- Storage and insurance. Tanks, terminals, salt caverns, boil-off, cover. Call it 7.00% a year.
- Convenience yield, subtracted. The value of holding the physical rather than a contract. A refiner that can actually run a barrel tomorrow will pay for that privilege.
The first two are close to fixed over any horizon that matters to a wave count. The third moves violently, because it is a direct read on how tight inventory is right now. When tanks are full, nobody pays much for immediacy and the convenience yield collapses toward zero. When the market is short of physical barrels, it can exceed financing and storage put together.
That is the whole mechanism. Set the convenience yield at 2.00% and net carry is +10.00% a year, which produces a curve rising 0.8368% a month. Set it at 16.00% and net carry is -4.00%, which produces a curve falling 0.3328% a month. Same equation. Same financing. Same tank rental.
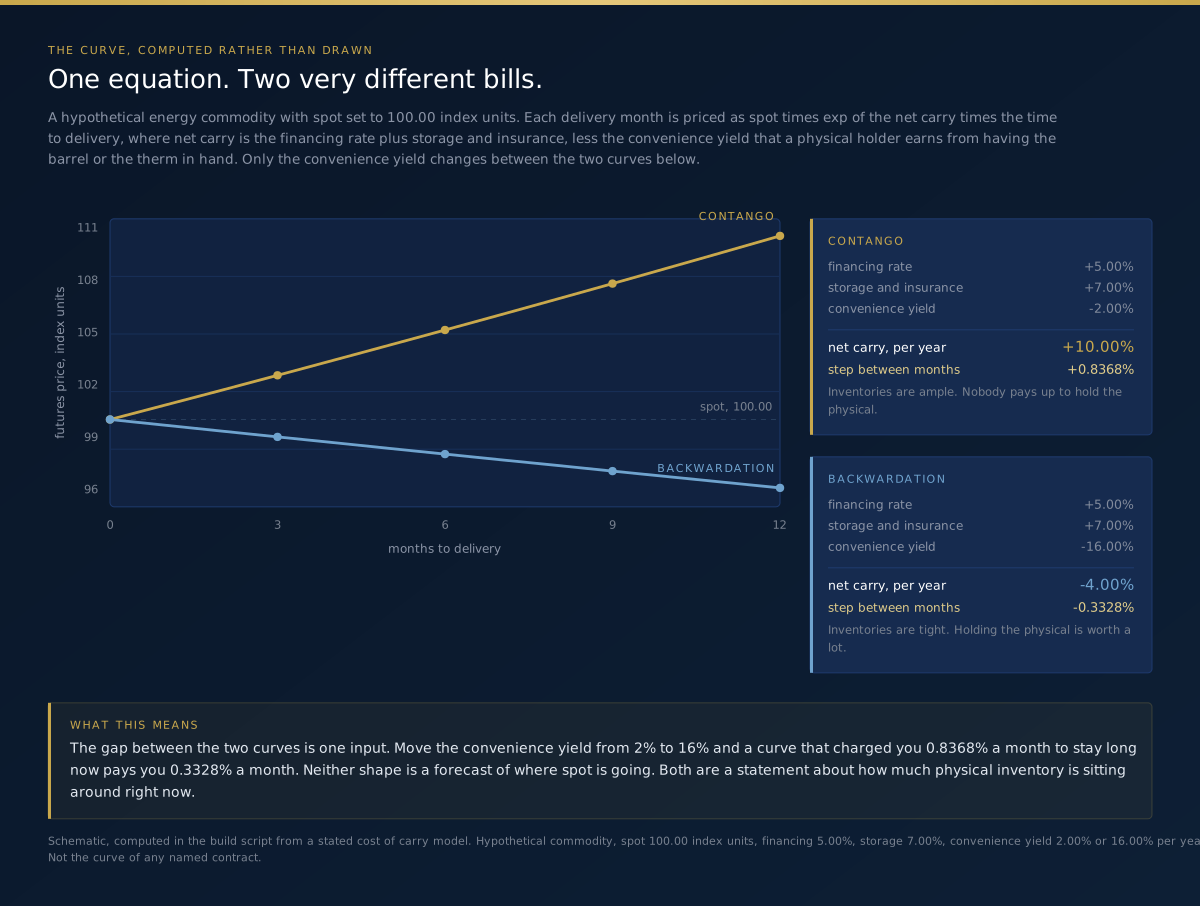
Contango against backwardation, side by side
| Contango | Backwardation | |
|---|---|---|
| Curve shape | Rises with delivery date | Falls with delivery date |
| What it says about inventory | Ample, comfortable, often oversupplied | Tight, immediate demand outbidding the future |
| Convenience yield in the model | 2.00% | 16.00% |
| Net carry per year | +10.00% | -4.00% |
| Step between adjacent months | +0.8368% | -0.3328% |
| A rolled long position over 12 months | Loses 9.52% of exposure | Gains 4.08% of exposure |
| A rolled short position | Collects the same 9.52% | Pays it |
| Typical regime | Post-glut, weak demand, high stocks | Supply disruption, cold snap, refinery outage |
Read the last two rows carefully, because they are where most of the damage is done. Contango is not a bearish signal. It is a tax on being long and a subsidy for being short, and it applies whether or not your directional view turns out to be right.
What a roll actually does
Here is the part that catches people. The roll does not cost you money in the sense of a debit. It costs you exposure.
Your front-month contract expires and converges to spot. In the model that convergence is exact, so the position is worth one unit of the commodity at 100.00. You close it. Cash in the account has not moved. Then you buy the next delivery, which is priced at 100.8368 because that is what the curve says. The same money now buys 0.991701 units instead of 1.000000.
Nothing looks wrong. No fee was charged. The account value is identical to what it was a minute ago. You simply control 0.83% less of the thing you are trying to be long of, and you will do it again next month, and eleven months later you will be holding 0.904837 units where you started with one.
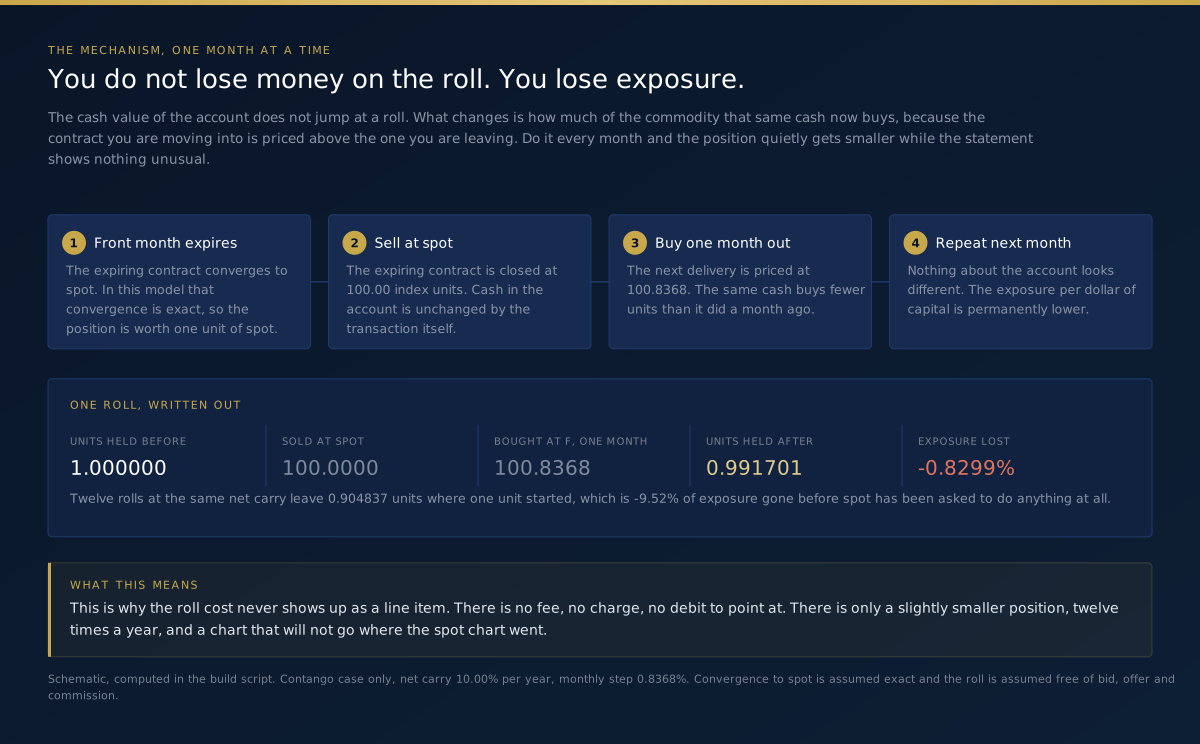
A modelled year, and a correct call that lost money
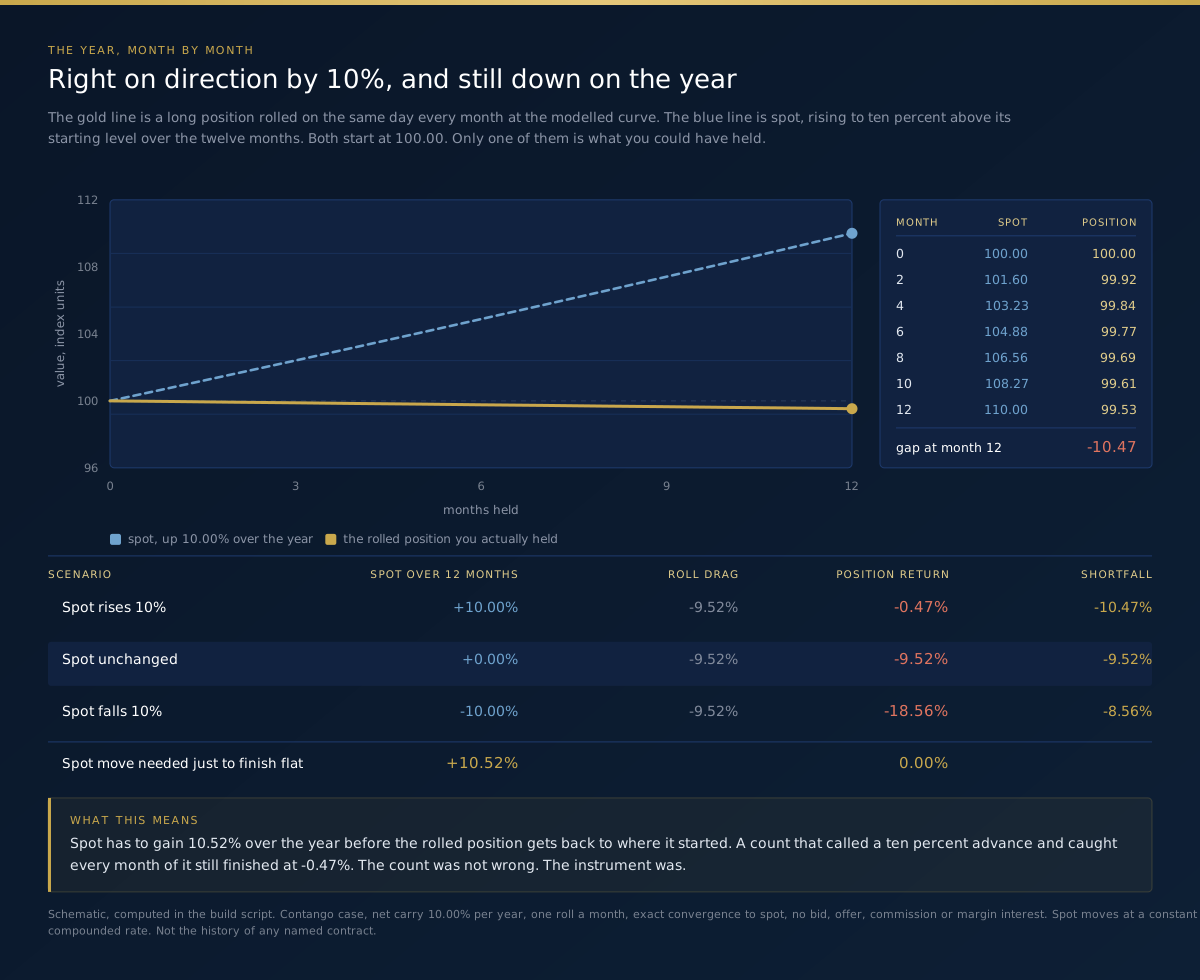
Now run it forward. Spot rises 10.00% over twelve months, compounding at a constant rate, and you are long the whole way through a monthly roll at the same modelled curve.
The position finishes at 99.53. That is a return of -0.47%.
You were right. You were right about direction, right about magnitude, right for twelve consecutive months, and the instrument handed you a small loss. Spot would have had to gain 10.52% just to leave you flat.
| Scenario over twelve months | Spot | Roll drag | Position | Shortfall against spot |
|---|---|---|---|---|
| Spot rises 10% | +10.00% | -9.52% | -0.47% | -10.47% |
| Spot unchanged | 0.00% | -9.52% | -9.52% | -9.52% |
| Spot falls 10% | -10.00% | -9.52% | -18.56% | -8.56% |
| Break-even requirement | +10.52% | -9.52% | 0.00% |
The middle row is the honest one. A market that does nothing for a year is a market that quietly removes about a tenth of your capital, and it does so without a single adverse price move to point at in a post mortem.
Why natural gas is worse than crude
Both markets can sit in contango. Gas is structurally more prone to it, for reasons that have nothing to do with sentiment.
Storing gas is harder than storing oil. It goes into depleted reservoirs, aquifers and salt caverns, and the capacity is finite, geographically fixed and seasonally contested. When injection season arrives and storage is filling, the physical market has no shortage of immediacy to sell, so the convenience yield falls close to nothing and the carry term dominates. The curve steepens.
Gas also has a hard seasonal shape stacked on top of the carry. Winter delivery is worth more than shoulder-season delivery because of heating demand, which means the curve is not a smooth exponential at all. It has humps. A roll that crosses from a cheap month into an expensive month costs far more than the average slope suggests, and a roll going the other way can briefly look free.
The practical consequence: a monthly-rolled gas position can face a roll cost that swings by an order of magnitude depending on which two months you happen to be crossing between. Averaging it out over a year hides that entirely.
What this does to a wave count
None of this touches the count. That is the uncomfortable part.
An impulse in spot is an impulse in spot. Wave structure describes collective behaviour in the underlying, and the underlying does not know or care what your broker charges to maintain synthetic exposure to it. So the count can be textbook and the trade can still be a loser.
Three specific consequences follow.
A multi-month target on spot is not a multi-month target on the instrument. If your count projects a wave three terminating 12% above the current level over roughly a year, and the curve carries 10.00% a year, the instrument delivers something close to nothing. Convert the target through the roll before you decide the trade is worth taking.
Invalidation levels drift. Your stop sits on a price. The instrument you hold reprices upward at every roll while the exposure shrinks, so a level that meant 2% of risk in month one does not mean 2% of risk in month eight. Reset it at each roll rather than setting it once and walking away.
Corrections cost more than they look. A fourth wave that takes three months to resolve costs you three months of carry on top of the retracement. In a steep contango that is a meaningful fraction of what wave five is expected to deliver, and it is charged before wave five starts.
Picking the instrument to match the horizon
The fix is not clever hedging. It is choosing an exposure whose cost structure fits how long you intend to hold.
| Horizon | What the roll does over that period | Reasonable exposure |
|---|---|---|
| Intraday to a few days | Nothing measurable | Front-month futures or a CFD on the front contract |
| One to eight weeks | One roll at most, cost is knowable in advance | Front-month futures, rolled deliberately, not automatically |
| Two to six months | Several rolls, drag becomes the dominant term for a modest target | Longer-dated single contract held to expiry, or equity exposure to producers |
| Six months and beyond | Drag can exceed the entire projected move | Producer equities, or accept that you are trading the curve as well as the direction |
Holding a single longer-dated contract to expiry removes the roll entirely, because you never roll: you own the carry you paid for on day one and you know exactly what it was. Producer equities carry their own problems, hedging books, balance sheets, dilution, but they do not decay at 0.8368% a month for the privilege of existing.
Trading backwardation is not free money either
The temptation is obvious. If contango charges a long and pays a short, find a backwardated curve and get long.
Backwardated markets are backwardated because physical supply is tight, and tight physical markets are exactly where the curve can flip to contango in a matter of days once the disruption resolves. The 4.08% a year you were collecting turns into a 9.52% a year charge, and the spot rally that justified the position unwinds at the same time.
Collect the carry when the curve offers it. Do not build a thesis on it.
What to check before you carry a count into a futures-backed product
Run this before the position, not after.
1. Read the curve. Two adjacent contracts is enough to get the slope and the sign. 2. Annualise the step. A 0.8% month is 10% a year, and a 10% year is most of a typical swing target. 3. Multiply by your expected holding period in months. That is your hurdle before the count contributes anything. 4. Compare the hurdle to the projected move. If the hurdle is more than about a third of the target, the instrument is wrong for the horizon. 5. Check whether the product rolls for you and on what schedule. Automatic rollers are the ones where the cost is least visible.
Most of the damage in energy trading is not done by bad counts. It is done by good counts expressed through a vehicle nobody priced.
Quick facts
- The futures curve is a cost of carry: financing plus storage and insurance, less convenience yield.
- Contango is an upward slope and charges anyone holding a long position through a roll.
- Backwardation is a downward slope and pays that holder instead.
- In the model here, a net carry of 10.00% a year is a step of 0.8368% between adjacent months.
- Twelve of those rolls leave 0.904837 units of exposure where one unit started, a loss of 9.52%.
- Spot has to gain 10.52% over the year for the rolled position simply to finish flat.
- Natural gas curves carry a seasonal shape on top of the carry, so roll cost varies by which two months you cross.
- The roll cost never appears as a fee, a charge or a line item, which is the reason it is so consistently ignored.
Frequently asked questions
Does contango mean the market expects higher prices? No, and treating it that way is the most common mistake in this area. An upward-sloping curve is mostly financing and storage. A market can be in deep contango while every participant expects lower prices, because carrying inventory has a cost whatever your view is.
If I hold the front-month contract and never roll, do I still pay it? You pay it once, at the price you bought. A single contract held to expiry has a known, fixed carry embedded in the purchase price and nothing accumulates on top. The compounding drag comes from repeatedly buying a higher contract with the proceeds of a lower one.
How steep does contango have to be before it matters? Compare the annualised carry to your projected move over the same horizon. A 2% annual carry against a 30% target is noise. A 10% annual carry against a 12% target has taken most of the trade before you start.
Can I count waves on a continuous futures chart? With care. Continuous charts splice contracts together at each roll, and depending on the adjustment method the splice either creates a gap or shifts the entire price history. Levels from before a splice may not be the levels you think they are. Count on spot or on a single contract, then execute where you must.
Does the same thing happen in metals and agriculture? Yes, at different magnitudes. Precious metals have low storage costs relative to value and usually sit in mild contango driven almost entirely by financing. Agricultural curves are dominated by harvest seasonality.
Is there a way to be long energy without paying the roll? Producer equities, physically settled positions, and longer-dated contracts held to expiry all avoid the repeated roll. Each carries a different set of risks. None of them is a free lunch, and the sensible framing is that you are choosing which cost you would rather pay rather than avoiding cost altogether.
COUNT THE STRUCTURE. PRICE THE INSTRUMENT. EW Strategy publishes daily Elliott Wave analysis across 27 instruments, with crude oil and natural gas among the four commodities covered on H4, Daily and Weekly. Annotated PDF reports, EWS Helix on WhatsApp for a second read when the curve moves overnight, and the position sizing and risk-reward calculators for turning a target into a size.
Further reading
Frequently asked questions
What is Elliott Wave analysis?+
Elliott Wave analysis is a form of technical analysis based on the theory that financial markets move in predictable wave patterns reflecting crowd psychology. Markets advance in five-wave impulse patterns and correct in three-wave patterns.
How accurate is Elliott Wave analysis?+
Accuracy depends on the analyst's skill, the instrument, and how the result is measured. At EW Strategy, every published call carries a direction, target levels and an invalidation level stated in advance, and every outcome is recorded against them. We are rebuilding that record from the raw archive under a measurement rule published before any figure, and we would rather show nothing than a headline number we cannot defend.
Can Elliott Wave analysis be used for day trading?+
Yes. Elliott Wave patterns appear at all timeframes, from 1-minute charts to monthly charts. Day traders typically focus on sub-minuette and minuette degree waves for intraday setups.
Elliott Wave analyst with 15+ years of experience. Covers 27 instruments daily across Forex, Commodities, Indices and Crypto. Founder of Artavest Oy, Helsinki.