
Gold's Delayed Reflex
A margin call is settled in dollars, and gold is one of the few things in a stressed book that can be sold today. Here is the balance sheet arithmetic, the two-phase shape it produces, and what it
Quick answer: Gold often falls in the first days of a market crash because a margin call is settled in dollars, and gold is one of the few sleeves in a stressed book that can be turned into dollars before the deadline. On a stated hypothetical book with USD 100m of equity and USD 400m of gross exposure, a USD 28m mark to market loss forces USD 84m of sales, three dollars sold for every dollar lost. The credit book takes weeks to exit and the equity book is already down, so the unimpaired liquid sleeve goes first. That selling is a fixed quantity with a deadline, which is why it stops abruptly. What replaces it is a smaller flow with no deadline.
Something breaks. Equities gap, credit spreads widen, the headlines write themselves, and the one asset everybody owns for exactly this moment goes down with everything else. Every cycle produces a fresh wave of people concluding that the safe-haven story is marketing.
It is not marketing. It is a story about the wrong week. The first phase of a panic is a funding event, and funding events settle in the currency the loan was written in. Nobody sells because they have changed their mind about gold. They sell because a clerk has given them a number and a time.
What the clerk actually asks for
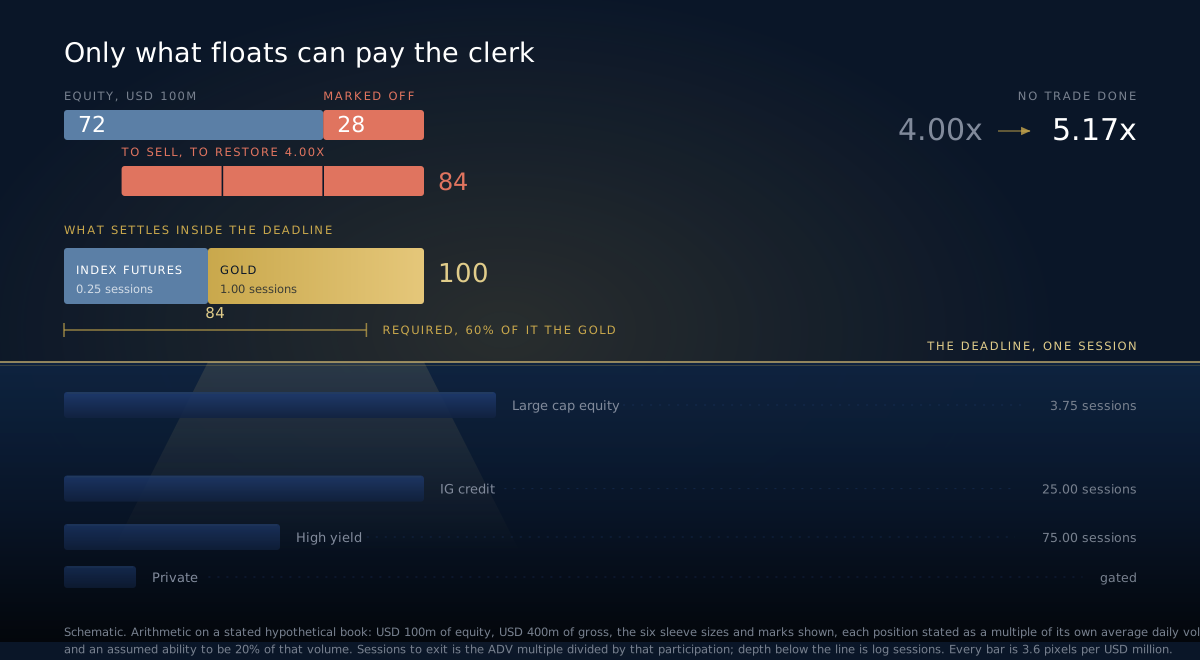
Take a stated hypothetical book, built from round numbers so every line below can be checked by hand. Equity of USD 100m. Gross exposure of USD 400m, so leverage of 4.0x. Six sleeves: index futures, gold held through futures and a bullion ETF, large cap equity, investment grade credit, high yield and loans, and a small private allocation that is already side-pocketed.
A shock lands overnight. Equities and futures are marked down 12%, investment grade credit 4%, high yield 8%. Gold is unchanged and the private sleeve carries a stale mark, so it is unchanged by definition rather than by luck. Total loss: USD 28m.
The loss lands entirely on equity, because that is what equity is for. Equity falls from 100 to 72. Gross falls by the same 28, from 400 to 372. Divide one by the other and leverage has risen from 4.00x to 5.17x with no trade done.
Every dollar of loss forces three dollars of selling
Restoring 4.0x on the new equity base means gross of 4 x 72, which is 288. The book carries 372. So 84 has to go.
That ratio is the mechanism, and it holds generally:
sales required = (leverage − 1) × loss
At 4.0x, every dollar lost forces three dollars out the door. At 6.0x it forces five. This is why a modest mark to market move produces selling wildly out of proportion to it, and why the headline that costs a long-only fund a bad afternoon costs a levered one its positioning.
Which sleeve can actually pay
The question stops being about value and becomes about settlement. Each sleeve carries a position expressed as a multiple of its own average daily volume, and the assumption is that you can be a fifth of a day's volume without the market noticing. Sessions to exit is the first divided by the second.
| Sleeve | Position, USD m | Loss today, USD m | Days of its own volume | Sessions to exit | Settles in time |
|---|---|---|---|---|---|
| Index futures | 40 | 4.8 | 0.05 | 0.25 | yes |
| Gold, futures and bullion ETF | 60 | 0.0 | 0.20 | 1.00 | yes |
| Large cap equity | 120 | 14.4 | 0.75 | 3.75 | no |
| Investment grade credit | 100 | 4.0 | 5.00 | 25.00 | no |
| High yield and loans | 60 | 4.8 | 15.00 | 75.00 | no |
| Private, side-pocketed | 20 | 0.0 | no market | gated | no |
The high yield book is where most of the damage will end up and it is 75 sessions from being cash. The credit book is 25. The private sleeve is not for sale at any price this quarter, which is what side-pocketed means. That leaves USD 100m that can settle inside the deadline against USD 84m required, and 60% of that 100m is the gold.
So the sale is not a choice between gold and something else. It is a choice between gold and missing the call.
There is a second reason, about damage rather than speed. Selling the equity book crystallises a loss into a falling tape and pushes what remains further down. The gold sleeve is unimpaired. You raise the cash without confirming the mark on anything you still hold.
Why the pressure has an end date
Forced selling is a quantity. That is the single most useful thing to understand about it.
The book above needs 84 by Friday. Once 84 is gone, that seller is not there on Monday, on Tuesday, or ever again for this episode. No residual pressure, no lingering bearishness, nothing overhanging the price. The order flow simply stops.
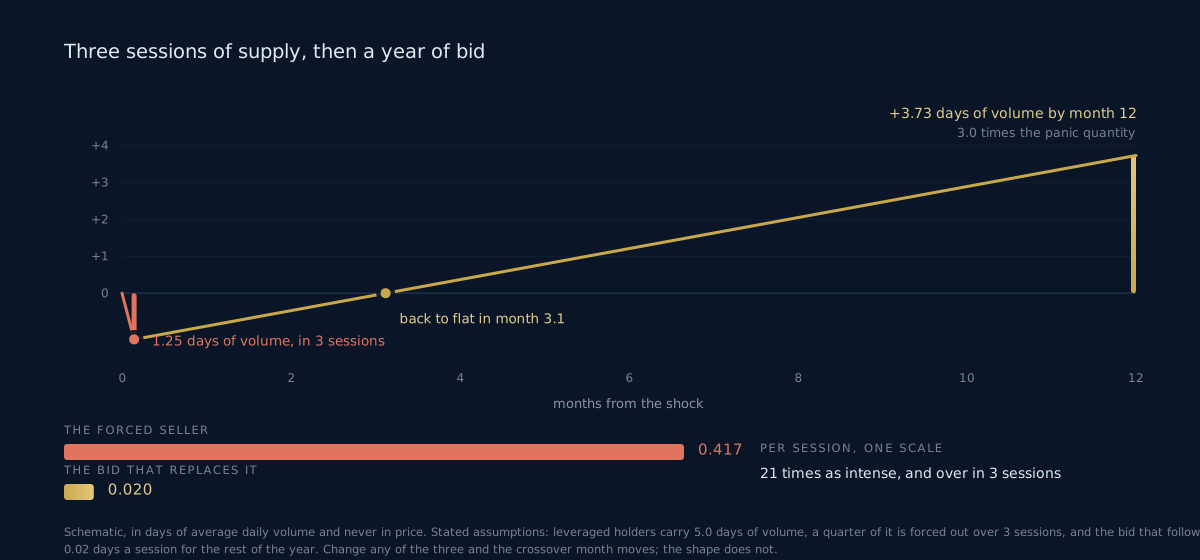
Put the cohort in units of volume rather than dollars, because volume is what the tape sees. Assume leveraged holders carry gold equal to five days of average daily volume and a quarter of it has to go over three sessions. That is 1.25 days of volume delivered at 0.417 a session. Enormous, one-sided, and finished by the end of the week.
What replaces it is nothing like that. A change of view about real rates, about counterparty risk, about how much of a reserve should sit in something with no issuer, arrives as an allocation decision. Allocation decisions get implemented slowly and carry no deadline. Assume that flow runs at 0.02 days of volume a session, 21 times gentler than the panic.
The two phases, side by side
| Phase one, the liquidation | Phase two, the re-rating | |
|---|---|---|
| What drives it | a deadline on a balance sheet | a change of view about rates and counterparties |
| Intensity, days of volume a session | 0.417 | 0.020 |
| Duration | 3 sessions | the rest of the year |
| Total quantity, days of volume | 1.25 | 4.98 |
| Ends when | the call is met | no fixed end |
| Where you notice it | on every screen, instantly | on a monthly chart, in hindsight |
Read the total row twice. Phase two moves four times the quantity phase one did, so slowly that most of the people who wrote about phase one have moved on. That is the delayed reflex. Gold does not react late. The reaction is a flow, and a flow takes months to add up to anything a chart can show you.
What this does to a corrective count
None of the above is worth much if it does not change what you mark.
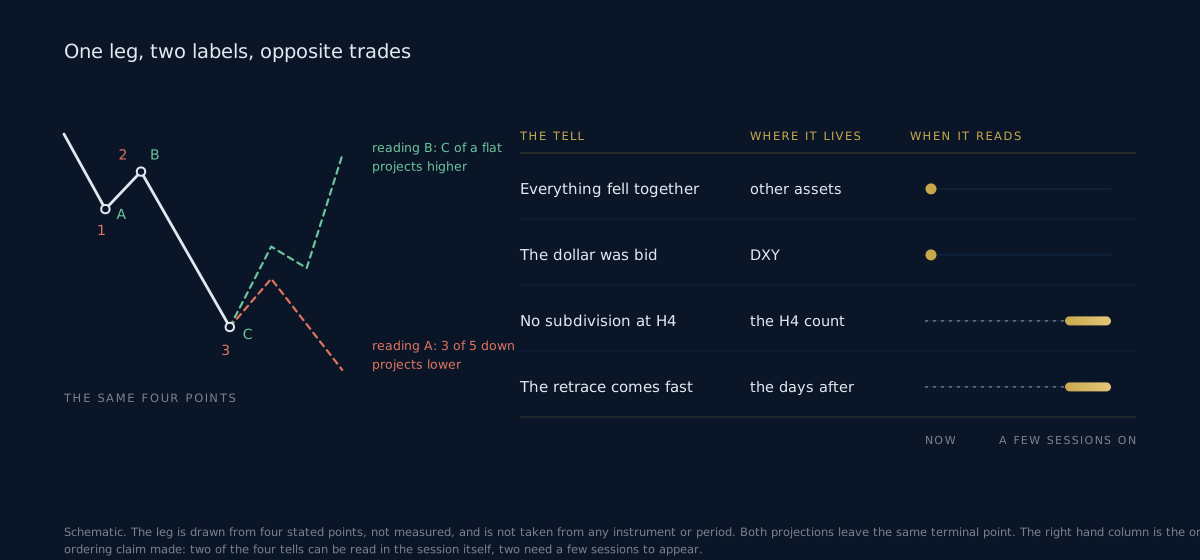
A liquidation leg is a fast, deep, one-directional move that terminates abruptly. On a Daily chart it carries two reasonable readings pointing in opposite directions. It can be the third wave of a developing impulse down, which projects lower and says sell rallies. It can be the C of a correction ending, which projects higher and says the low was the opportunity.
Same drawn leg. Same candles. Opposite trade.
Four tells, none of them on the gold chart
Everything fell together. Assets with no economic relationship declining in the same session is the signature of a funding event. If bonds, gold, equities and the liquid end of crypto all go at once, you are watching balance sheets rather than structure.
The dollar was bid into it. The scramble is for the settlement currency. A gold decline against a rising dollar is a very different object to one against a soft dollar.
No clean subdivision at lower degree. Drop to H4. A genuine third wave subdivides into five. A margin leg often refuses to, because it is a single vertical run produced by one kind of order.
The retrace comes fast. Quantity-driven lows tend to be recovered quickly once the deadline passes, because the seller who made the low has gone. A real first wave down does not hand the level back in a week.
Two of those cost nothing and are available in real time. The other two need a few sessions, which is the honest answer to how quickly you can know.
Where this argument is weak
Three objections, and the first is serious.
The mechanism explains direction and says almost nothing about size. Whether the forced quantity moves the price a little or a lot depends on who is on the other side, and that varies enormously between episodes. Anyone quoting you a panic drawdown percentage in advance is guessing.
It also assumes a leveraged marginal holder. Where that holder is an unlevered central bank or a retail allocator with no margin account, phase one can be small or absent. Ownership composition decides this, and it changes over decades.
Phase two is not automatic either. It needs the shock to change something real about rates or about counterparty trust. A panic that resolves in a fortnight with no policy response produces phase one and then nothing. The mechanism gives you a shape to test, not a promise.
How to handle the first fortnight
Run the count on Weekly and Daily and treat H4 as execution only. Panic legs distort the lowest degree you are watching, and a count that lives there gets re-marked three times in a week.
Mark both readings on the same chart. Put the invalidation where reading A dies rather than where your preferred reading is comfortable, and accept that funding events will stop you out of some correct counts. That is the cost of trading through them.
Size for the gap, not the level. A stop inside a liquidation window is an instruction, not a price, and the arithmetic on what that costs is in the piece on fat tails and stops.
Do not add on the way down because the mechanism says the pressure is temporary. Temporary carries no length. Three sessions is a stated assumption, not a measurement.
Quick facts
- A margin call settles in the currency of the loan, so the first phase of a panic is a dollar event rather than a gold event.
- On the stated hypothetical book, a USD 28m loss forces USD 84m of sales: sales equal leverage minus one, times the loss.
- Leverage went from 4.00x to 5.17x overnight with no trade done, because equity absorbs the whole loss.
- Only USD 100m of the USD 400m book settles inside the deadline, and 60% of that is the gold sleeve.
- The high yield book carries most of the eventual damage and is 75 sessions from being cash at 20% participation.
- Forced selling is a fixed quantity with a deadline. The bid that replaces it is a small flow with none.
- Phase one delivers 1.25 days of average volume in three sessions. Phase two delivers 4.98 over the following year.
- No gold price, drawdown or duration is quoted here. Those need the measured data series.
Frequently asked questions
Does this mean gold is not a safe haven? It means the label describes the second phase and gets applied to the first. What gold does during a funding scramble is set by who owns it and how they financed it. What it does over the following year is set by real rates and by trust in counterparties. Both are true at once, and for a few weeks they point opposite ways.
How long does the first phase last? Nobody knows in advance, and the three sessions above is a stated assumption chosen to keep the arithmetic checkable. What you can know is what ends it. Watch for the session where selling stops being one-directional and starts trading both ways.
Does this happen in every crash? No, and the exception explains the rule. Phase one needs a levered marginal holder facing a dollar call. Where the marginal holder is an unlevered official institution, the mechanism has nothing to act on. That is why what the tape actually did in each episode matters more than the theory does.
Should I buy the low that forced selling makes? Only if something other than this article tells you where it is. The mechanism says a finite seller leaves. It says nothing about the price at which the quantity clears, and direction without level is not a trade.
Does holding physical instead of futures avoid the problem? It stops you being the forced seller. It does not avoid the price effect, because price is set at the margin by whoever has to trade. Sitting through phase one rather than being liquidated inside it is a real advantage and a different one.
How should this change my invalidation level? Not its location. Put it where the count fails and leave it there. What changes is the size you carry into a week where funding stress is plausible, and how much weight you give one break of that level when every other asset broke in the same session.
A COUNT TELLS YOU THE SHAPE. THE FUNDING TELLS YOU THE WEEK. EW Strategy publishes daily Elliott Wave analysis across 27 instruments, 11 FX pairs, 4 commodities, 5 indices and 7 crypto, on H4, Daily and Weekly. Annotated PDF reports on XAUUSD and the dollar complex, EWS Helix on WhatsApp when a level breaks faster than you can watch it, and the position sizing and risk and reward calculators.
Further reading
Frequently asked questions
What is Elliott Wave analysis?+
Elliott Wave analysis is a form of technical analysis based on the theory that financial markets move in predictable wave patterns reflecting crowd psychology. Markets advance in five-wave impulse patterns and correct in three-wave patterns.
How accurate is Elliott Wave analysis?+
Accuracy depends on the analyst's skill, the instrument, and how the result is measured. At EW Strategy, every published call carries a direction, target levels and an invalidation level stated in advance, and every outcome is recorded against them. We are rebuilding that record from the raw archive under a measurement rule published before any figure, and we would rather show nothing than a headline number we cannot defend.
Can Elliott Wave analysis be used for day trading?+
Yes. Elliott Wave patterns appear at all timeframes, from 1-minute charts to monthly charts. Day traders typically focus on sub-minuette and minuette degree waves for intraday setups.
Elliott Wave analyst with 15+ years of experience. Covers 27 instruments daily across Forex, Commodities, Indices and Crypto. Founder of Artavest Oy, Helsinki.