XAGUSD Elliott Wave: Last Leg of Wave A Before the B Bounce
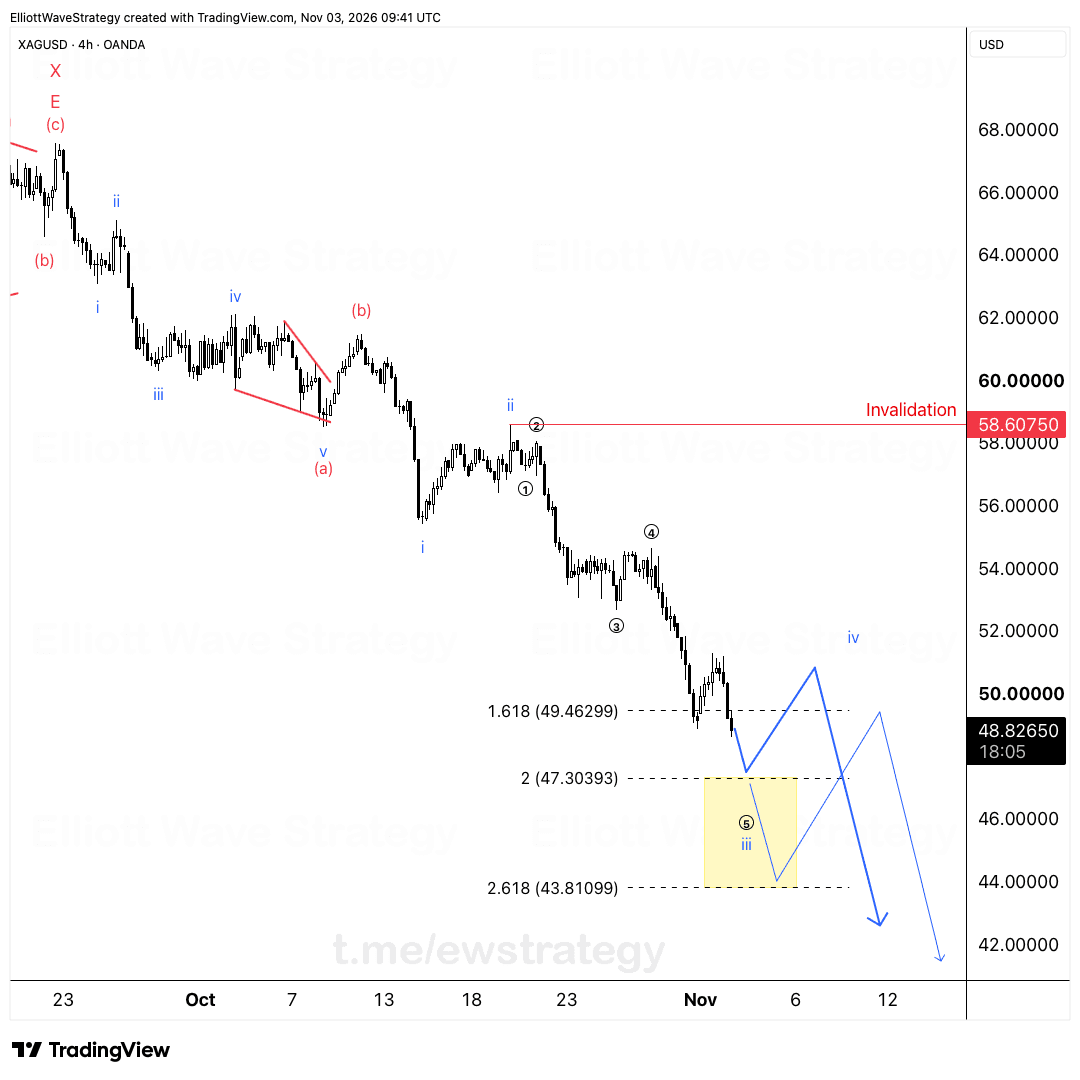
Silver has broken below $47.30 and $43.81, the levels we flagged in the 3 November update. It bounced, rolled over again, and made another low on Friday.
Silver has broken below $47.30 and $43.81, the levels we flagged in the 3 November update. It bounced, rolled over again, and made another low on Friday.
That is what a market looks like when sellers still control the tape. Here is how I read it on the daily chart.
Where is XAGUSD in the Elliott Wave count?
The chart shows a large double-correction structure after the wave (III) top near the 120 area. Wave W is labeled, then the (X) bounce, and now the second leg, Y, is in progress with (Y) as the larger label.
Inside that Y leg, the first part was a triangle labeled (a) through (e). The drop out of that triangle is the first leg of the bigger C wave, and I count it as wave A.
Is silver finished falling, or is there more downside?
Not finished. On the chart, the sub-waves of A read (i), (ii), (iii) with (iv) behind us. Wave (iii) is done and (v) is still ahead.
I think silver is in the last leg of that wave A. That means one more low first, then a bigger bounce.
The price printed on the chart is 41.259. The yellow zone around 55 to 58 was support for months. It broke, and it now acts as the ceiling where this count gets tested.
What comes after wave A: the B-wave bounce
Once wave (v) finishes, wave A is complete and wave B starts. My drawn path shows a bounce that rises toward the 50 area before the next decline begins.
A B-wave is a correction inside a correction. It will feel like a recovery, and traders who bought the dip will call the bottom. That is the usual trap. The structure says the bigger C leg comes after, with the arrow on the chart pointing toward the 30 area.
What invalidates this silver count?
Invalidation is 58.50. A move back above it and this count is wrong.
That level sits at the top of the (iv) area, so a push through it would break the wave structure itself. Wave (iv) cannot overlap the territory of wave (i) in an impulse, and the whole A-wave count depends on that rule. If price gets above 58.50, I drop this count and rebuild from scratch.
This is analysis and education, not a trade signal. The point of a defined invalidation is to know exactly when the idea stops being valid.
For more on how I read metals structure, see the commodities pillar page and the live XAGUSD analysis.
Key Takeaways
- •XAGUSD has broken below $47.30 and $43.81, the levels flagged in the 3 November update, and made another low on Friday.
- •The Elliott Wave count treats the drop out of the triangle as wave A of the C wave, with (iii) complete and (v) still ahead.
- •XAGUSD is expected to make one more low to finish wave A, followed by a bigger bounce in wave B.
- •The XAGUSD bearish count is invalidated by a move back above 58.50.
- •The structure on the chart is a double correction (W, X, Y) after the wave (III) peak, with the larger Y leg still developing.
Frequently Asked Questions
What invalidates the bearish XAGUSD Elliott Wave count?
A move back above 58.50 invalidates the count. That level sits at the top of the wave (iv) area, so a break above it would violate the impulse structure of wave A.
Is silver in wave A or wave C right now?
Silver is in wave A of the larger C wave, specifically the last leg, wave (v). One more low is expected before wave A completes and a wave B bounce begins.
What does the triangle in the silver chart mean?
The triangle labeled (a) through (e) was a consolidation inside the Y leg. The break lower out of it started wave A of the C wave, which is the decline still in progress.
Disclaimer: This analysis is for educational purposes only and does not constitute financial advice. Elliott Wave analysis involves subjective interpretation. Always do your own research and manage your risk accordingly.
Get Full Coverage for All 27 Instruments
Premium members receive daily wave counts with entry zones, targets and invalidation levels, published daily across all 27 instruments.
View Premium Plans