
The Liquidity Tide Beneath Every Wave
Wave structure gives you the shape of a move. The liquidity regime decides how far it gives back before it resolves. The transmission chain, the three regimes, and which of 27 instruments actually
Quick answer: A central bank balance sheet is the one macro condition that reaches FX, commodities, indices and crypto at the same time, and it works through plumbing rather than through mood. When the bank buys a bond it takes duration out of private hands and leaves a deposit behind, and whoever ends up holding that deposit has to buy something else. That substitution chain is what you see on a chart as a correction that stops too early and a trend that refuses to end. It gives you no direction and no level. What it gives you is the kind of tape your count has to survive.
This is the first article in the EW Strategy series, so it has to say what the rest of it is for. We publish two readings and we keep them apart on purpose. Wave structure gives you shape: where price sits in a sequence, what has to happen next for the reading to hold, and the exact level at which the reading is dead. That part is self-contained. You can do it with a chart and nothing else, and most days you should.
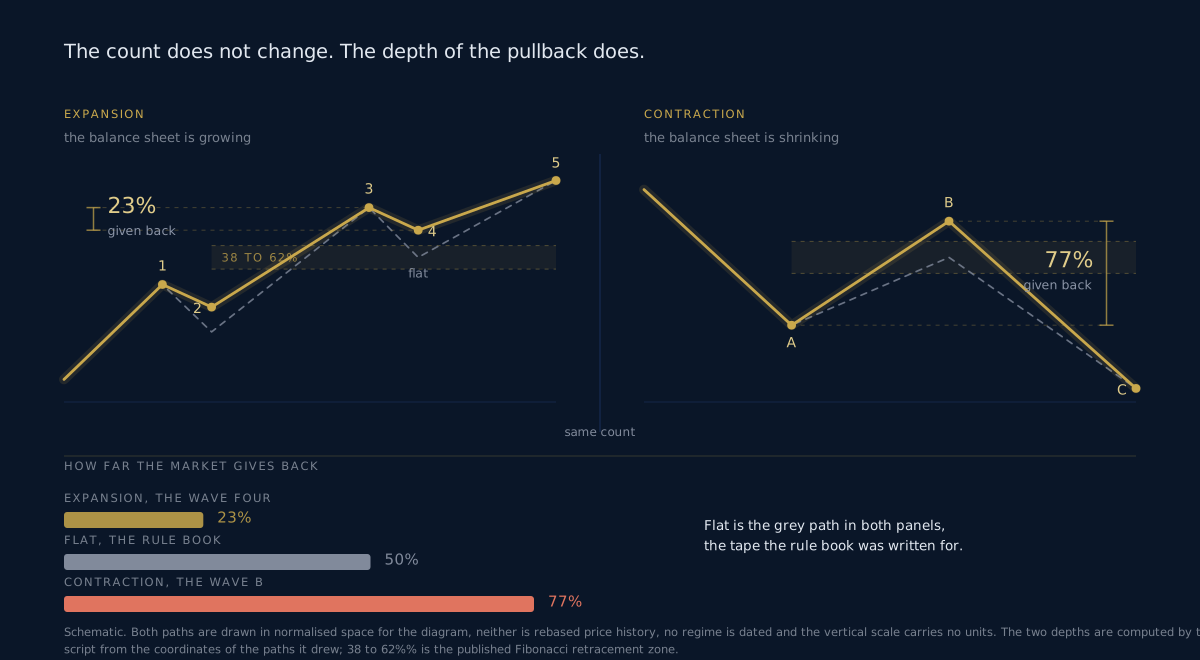
The second reading is the condition the move travels through. Same count, same ratios, different medium. A fourth wave in an expanding-liquidity tape stops at a level that looks too shallow to be real, and it is real. The same fourth wave in a draining tape goes straight through it, and the trader who sized for the first case is gone by Thursday. Nothing in the rule book changed. What changed is who else was in that market, and why they were there.
Two readings, and why they stay separate
Mixing them is the standard error. It produces analysis that sounds like macro and trades like nothing, because a view about liquidity carries no entry, no invalidation and no time limit.
Keep the jobs distinct. The count tells you what this move is and where you are wrong. The regime tells you how the tape will behave while you find out. One is a structural claim about a named instrument. The other is a condition affecting all of them at once, which is exactly why it can never be your trade.
Everything in this series sits on one side of that line. The instrument pieces, on DXY composition or the futures curve in energy, are about the object you trade. The macro pieces, this one included, are about the water it sits in.
What a balance sheet actually is
Strip the politics out and it is an accounting identity. On one side the central bank holds assets it has bought, mostly government debt and its close relatives. On the other side sit the liabilities it created to pay for them, which are reserve balances held by commercial banks, plus physical currency.
Two things follow, and both are routinely mangled in retail macro.
Reserves do not circulate in the real economy. They sit inside the banking system and are traded between banks, which is why an expansion can coincide with quiet consumer prices and roaring asset prices for a long stretch.
And the asset side matters more than the total. Buying short bills is a different operation from buying long bonds, because the second takes duration risk out of the market and the first mostly does not.
How the expansion reaches a price
The popular version is that money printing lifts all assets. It explains nothing, predicts less, and cannot tell you why one instrument runs while another sits still.
The real route is narrow. A central bank transacts in a handful of markets. Everything else moves because a chain of private holders had a portfolio problem and solved it in the only direction available to them.
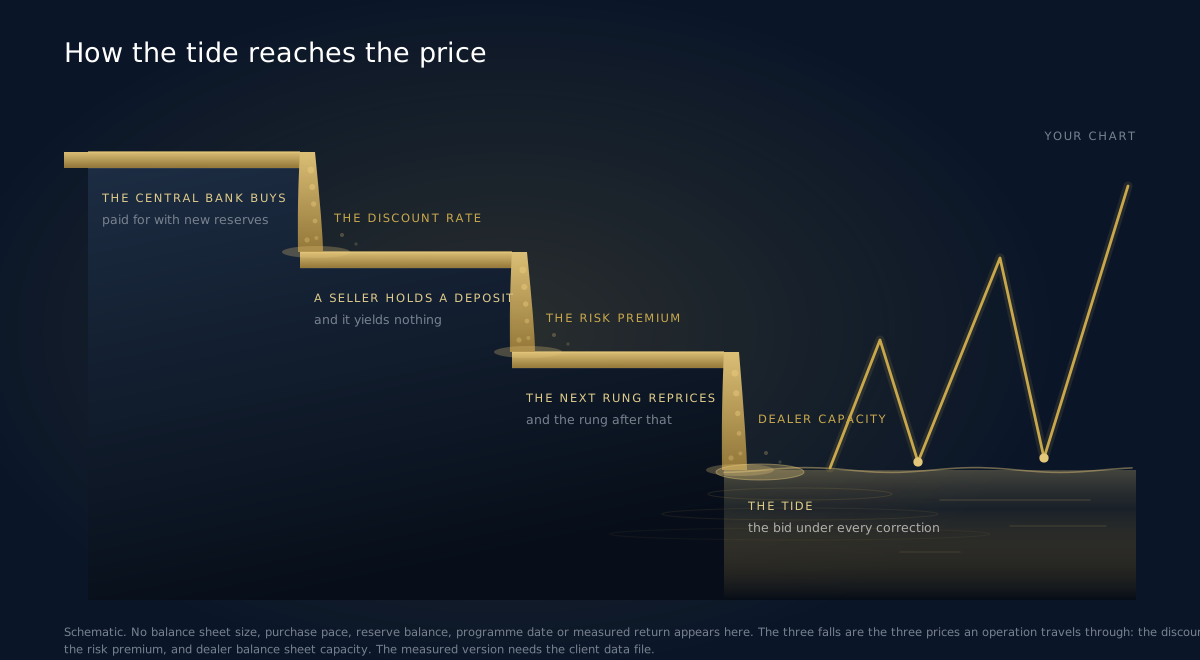
The seller of the bond is the hinge. A fund that held duration to meet a liability now holds a deposit that meets nothing. The liability did not go away. So the deposit becomes a corporate bond, and the seller of that corporate bond faces the same problem one rung further out, and the chain runs until it reaches assets nobody would describe as safe at all.
Three prices move on the way. The discount rate, because buying duration compresses the term premium and every valuation in the market divides by that number. The risk premium, because a forced buyer walking down the quality ladder lowers the compensation demanded at each rung. And dealer balance sheet capacity, which is the least discussed of the three and often the one you feel: when reserves are plentiful, market makers quote tighter and absorb larger shocks, so a piece of bad news gets digested instead of gapping.
The three regimes, and what each does to a correction
You only need three states, and you can name the current one in a sentence. Growing, flat, or shrinking.
| Expansion | Hold | Contraction | |
|---|---|---|---|
| Typical corrective depth | shallower than the ratios suggest | as written in the rule book | deeper, and often more than once |
| Counter-trend rallies | small, quickly overrun | proportionate to the leg | violent enough to look like reversals |
| A level that fails | usually a shakeout inside the trend | take it at face value | the count is probably wrong |
| Cost of being early | time | a stop | a stop, several times over |
| What to do about size | normal | normal | carry less, and expect to wait |
The middle column is the one people forget exists. A flat balance sheet is not a neutral in-between state; it is the condition in which the textbook works as written, which makes it the easiest tape to trade and the least discussed.
Contraction deserves the warning it gets. When reserves drain, the marginal buyer under every correction is smaller, and the market discovers this in a hurry rather than gradually. The rallies inside those declines are the thing to watch, because they are frequently larger and faster than anything an expansion produces, and they are corrective anyway.
Why the tide gives you no direction
Here is the limit, stated in the same breath as the claim, because the claim is worth nothing without it.
Liquidity is not a signal. It has no entry, no stop and no target. Markets have risen through drains and fallen through expansions, and anybody who tells you otherwise is selling a single chart with two lines on it and hoping you do not ask about the periods where they diverge.
What the regime does is condition the distribution of outcomes. It shifts the odds on retracement depth, on how much a shock is absorbed, and on whether a broken level means anything. Priors are the honest word for that. A prior changes how you size and how long you wait. It does not tell you which way to face.
Anyone who has spent a season trading a liquidity thesis instead of a chart knows the failure mode. The thesis is eventually right and the position is long gone.
Which of the 27 instruments feels it most
Liquidity sensitivity is a property of price composition rather than of asset class. Ask one question of any instrument: how much of this price is a discounted future, and how much is a physical constraint?
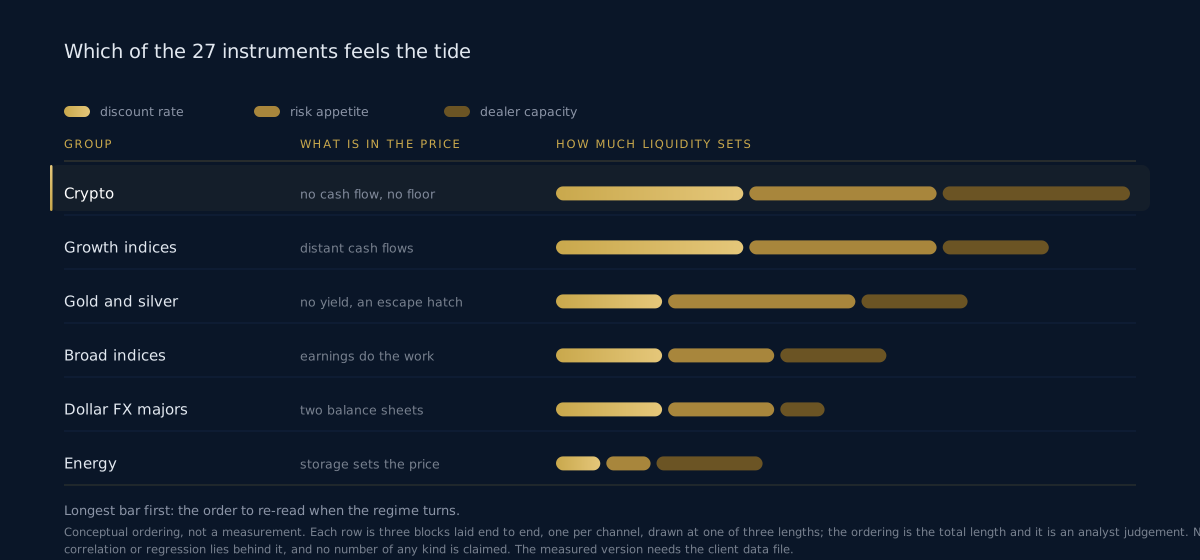
Crypto sits at the top of that ordering for a structural reason rather than a cultural one. There are no cash flows to discount and no physical floor under the price, so what is left is close to pure risk appetite. Long-duration equity indices come next, because most of the valuation lives in distant cash flows and a moved discount rate repositions the whole index arithmetically before anybody has an opinion about it.
Gold sits awkwardly, and honestly so. It pays nothing, so its holding cost is whatever the alternative pays. It is also the escape hatch from the currency doing the expanding. Those two pull in opposite directions, which is why the gold pieces in this series exist at all.
Energy is the useful counter-example. Storage, delivery and physical supply set the price, and liquidity reaches it slowly through demand expectations. A regime shift is not a reason to redraw a natural gas count.
The balance sheet is not the whole tide
Three honest additions, because the single-series version of this argument is too neat.
Price and quantity are different levers. A central bank can hold its balance sheet flat while moving the policy rate hard in either direction. The two usually travel together and sometimes do not, and the periods where they diverge are exactly the ones that break simple models.
Government borrowing competes for the same money. A large deficit issues assets into the same pool the central bank is buying from. Treating the central bank in isolation misses half the arithmetic.
Private credit creation dwarfs both. Commercial bank lending, dealer repo and collateral reuse create and destroy far more spendable claims than any official programme. When those contract, the tide goes out whatever the official series is doing.
The practical consequence: use the balance sheet as the visible proxy for a condition you cannot observe directly. Do not mistake the proxy for the thing.
Folding it into a wave workflow
Four habits, and none of them involves changing a count.
Name the regime before you mark up. One line in your notes. Growing, flat, or shrinking, and the date you last checked. If you cannot write it, you are not carrying a macro view, you are carrying a mood.
Let it set expected depth, not direction. In expansion, take shallow retracements seriously as complete. In contraction, expect the deeper end of the range and expect to see the level tested more than once.
Size to the regime, never position to it. This is where the edge actually is. The same 1% risk budget in a draining tape buys you a smaller position, because your stop needs to be further away for the same structural reason.
Re-read your most sensitive counts first when it turns. Crypto and the long end of the index complex, in that order. Your energy counts can wait.
What this framing cannot do
It cannot time anything. Balance sheet data is published with a lag and revised, markets front-run announced programmes, and the effect on any single instrument is swamped by that instrument's own news on most days.
It cannot survive being turned into a rule. Every mechanical version of buy expansion, sell contraction has a long list of periods where it lost money, and the ones being marketed today have been fitted to the periods where it did not.
And it cannot rescue a bad count. If the structure says the reading is dead at a level, it is dead at that level, whatever the tide is doing underneath. The regime changes what you expect on the way to that level. It never moves the level.
Quick facts
- No balance sheet size, growth rate, purchase pace, reserve balance, programme date or measured asset return appears in this article. Those need the measured data series.
- The regimes are named as classes of condition: growing, flat, shrinking.
- Reserves created by asset purchases sit inside the banking system and are not spendable in the real economy.
- The asset side matters more than the total, because buying long duration is a different operation from buying bills.
- The transmission runs through three prices: the discount rate, the risk premium, and dealer balance sheet capacity.
- Liquidity conditions inform expected retracement depth. They do not inform direction.
- Sensitivity across the 27-instrument universe runs roughly from crypto and long-duration indices at the top to energy at the bottom.
- Central bank balance sheets are a proxy. Private credit creation is larger and less visible.
Frequently asked questions
Does an expanding balance sheet mean markets go up? No. The relationship is a tendency about depth rather than a rule about direction, and markets have fallen through expansions and risen through drains. What expansion changes is how much a dip gets bought, which reaches your chart as retracements that end sooner than the ratios suggest.
How often should I check the regime? Monthly is enough for a Daily or Weekly count. This is a slow-moving condition, and if you find yourself refreshing a balance sheet series intraday you have converted a prior into a trading signal, which is the mistake this article exists to argue against.
Which balance sheet matters, given four large central banks? The combined one, converted to a single currency, because capital moves between them. A dollar drain met by an expansion elsewhere is a very different condition from a synchronised drain, and the second is rare and unmistakable.
Why does crypto react hardest? Because there is nothing else in the price. No cash flow to discount and no physical constraint to floor it, so risk appetite is close to the whole of the valuation. That makes the 7 crypto instruments the most liquidity-sensitive part of the universe and the place a regime change shows up first.
Can I trade the liquidity regime directly? Almost nobody should. It has no invalidation level and no time limit, which means it cannot be sized or stopped, and a position with neither is not a trade. Use it to condition trades that do have both.
If liquidity is this important, why is the whole series about wave structure? Because structure is the part that gives you an entry, an invalidation and a target on a named instrument. Liquidity conditions the tape. It cannot tell you what any specific chart is about to do, and a framework that answers everything answers nothing.
STRUCTURE FIRST, CONDITIONS SECOND. EW Strategy publishes daily Elliott Wave analysis across 27 instruments, 11 FX pairs, 4 commodities, 5 indices and 7 crypto, on H4, Daily and Weekly. Annotated PDF reports, EWS Helix on WhatsApp when a level goes overnight, and the Fibonacci, position sizing and risk and reward calculators for the part of this that is arithmetic rather than judgement.
Further reading
Frequently asked questions
What is Elliott Wave analysis?+
Elliott Wave analysis is a form of technical analysis based on the theory that financial markets move in predictable wave patterns reflecting crowd psychology. Markets advance in five-wave impulse patterns and correct in three-wave patterns.
How accurate is Elliott Wave analysis?+
Accuracy depends on the analyst's skill, the instrument, and how the result is measured. At EW Strategy, every published call carries a direction, target levels and an invalidation level stated in advance, and every outcome is recorded against them. We are rebuilding that record from the raw archive under a measurement rule published before any figure, and we would rather show nothing than a headline number we cannot defend.
Can Elliott Wave analysis be used for day trading?+
Yes. Elliott Wave patterns appear at all timeframes, from 1-minute charts to monthly charts. Day traders typically focus on sub-minuette and minuette degree waves for intraday setups.
Elliott Wave analyst with 15+ years of experience. Covers 27 instruments daily across Forex, Commodities, Indices and Crypto. Founder of Artavest Oy, Helsinki.