
The Basics of Elliott Wave Theory
Technical analysis seeks to interpret market behavior by studying historical price action and volume. Within this domain, Elliott Wave Theory stands out as a sophisticated approach that combines chart patterns with the psychology of market participants. The theory suggests that markets do not move in a random fashion; instead, they follow specific, repetitive wave patterns driven by collective investor sentiment-ranging from euphoria to fear.
What Is Elliott Wave Theory?
Elliott Wave Theory is a form of technical analysis developed by accountant and market theorist Ralph Nelson Elliott in the 1930s. At its core, the theory posits that market prices move in identifiable patterns called “waves,” which reflect shifts in crowd psychology. Despite evolving market conditions, human emotions-greed, fear, hope, denial-remain relatively consistent over time, causing these repetitive patterns to emerge in price charts.
Prices are not random; they form structured patterns (waves) repeatedly. Emotions drive buying and selling behaviors, creating predictable ebbs and flows. Each wave can be subdivided into smaller waves, mirroring the larger pattern on different timeframes-this is the fractal nature of Elliott Wave.
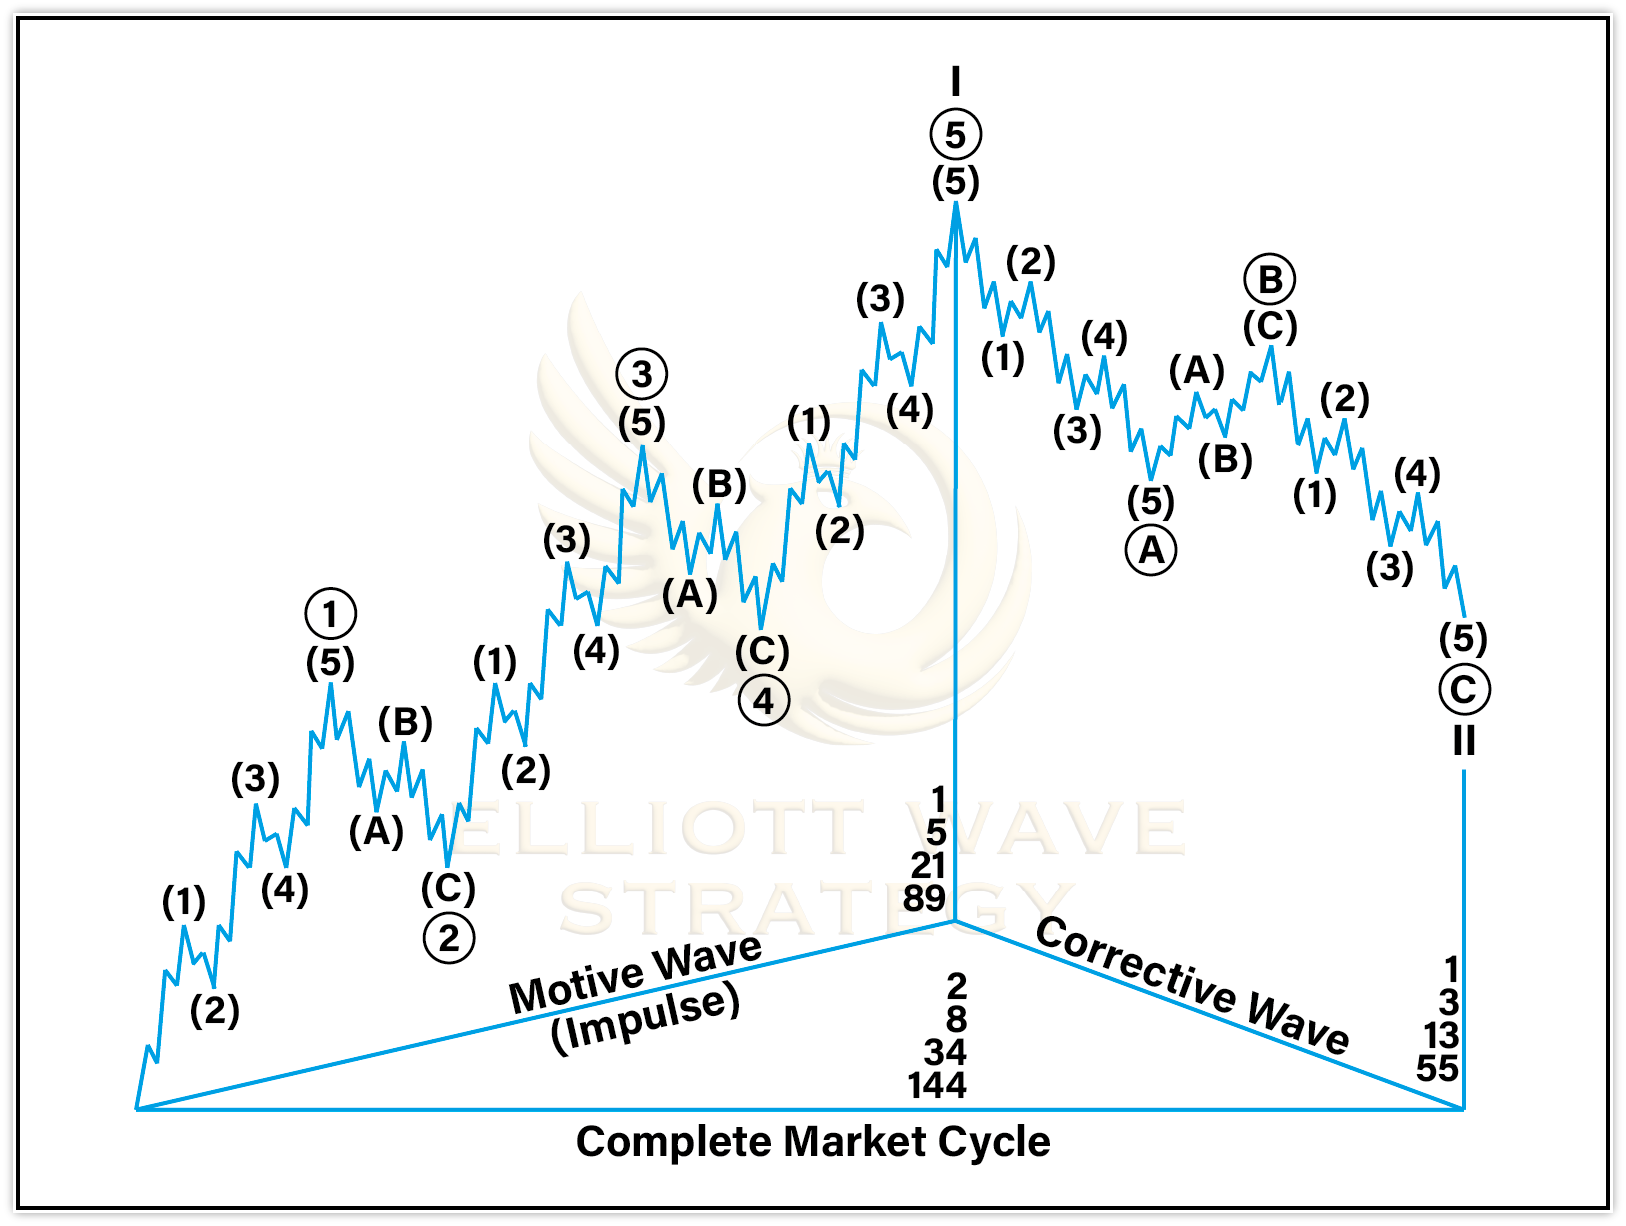
Markets typically move in a 5-wave impulse in the direction of the dominant trend, followed by a 3-wave correction against that trend. When these 8 waves (5 up, 3 down in a bull market) finish, a new cycle often begins-either continuing the larger trend or reversing it.
History & Origins
Ralph Nelson Elliott was a professional accountant who, after a serious illness in the 1930s, devoted his time to studying 75 years of US stock market data. By 1938, he had distilled his findings into a manuscript titled “The Wave Principle,” co-authored with Charles Collins.
Elliott observed that markets move in a series of five waves in the direction of the main trend, followed by a corrective three-wave move against the trend. He believed these patterns reflected the natural rhythm of crowd behavior-the collective optimism and pessimism of market participants.
After Elliott’s death in 1948, his work lay largely dormant until the 1970s, when Robert Prechter and A.J. Frost revived and expanded upon it in their 1978 book “Elliott Wave Principle: Key to Market Behavior.” This book became the definitive text on the subject and introduced a new generation of traders to the theory.

Core Principles of Elliott Wave Theory
The theory is built on two primary wave types: Motive Waves and Corrective Waves. Motive waves move in the direction of the larger trend and consist of five sub-waves. Corrective waves move against the larger trend and consist of three sub-waves.
The five-wave impulse structure labels waves 1, 2, 3, 4, and 5. Waves 1, 3, and 5 are motive; waves 2 and 4 are corrective. The three-wave correction labels waves A, B, and C. Three cardinal rules govern valid impulse waves: Wave 2 cannot retrace more than 100% of Wave 1; Wave 3 cannot be the shortest of Waves 1, 3, and 5; Wave 4 cannot overlap Wave 1’s price territory.
Within every impulsive wave, you can often find smaller 5-wave structures, and within every corrective wave, smaller 3-wave structures. While certain rules are strict, many aspects of Elliott Wave are guidelines rather than absolutes.
Wave Structure
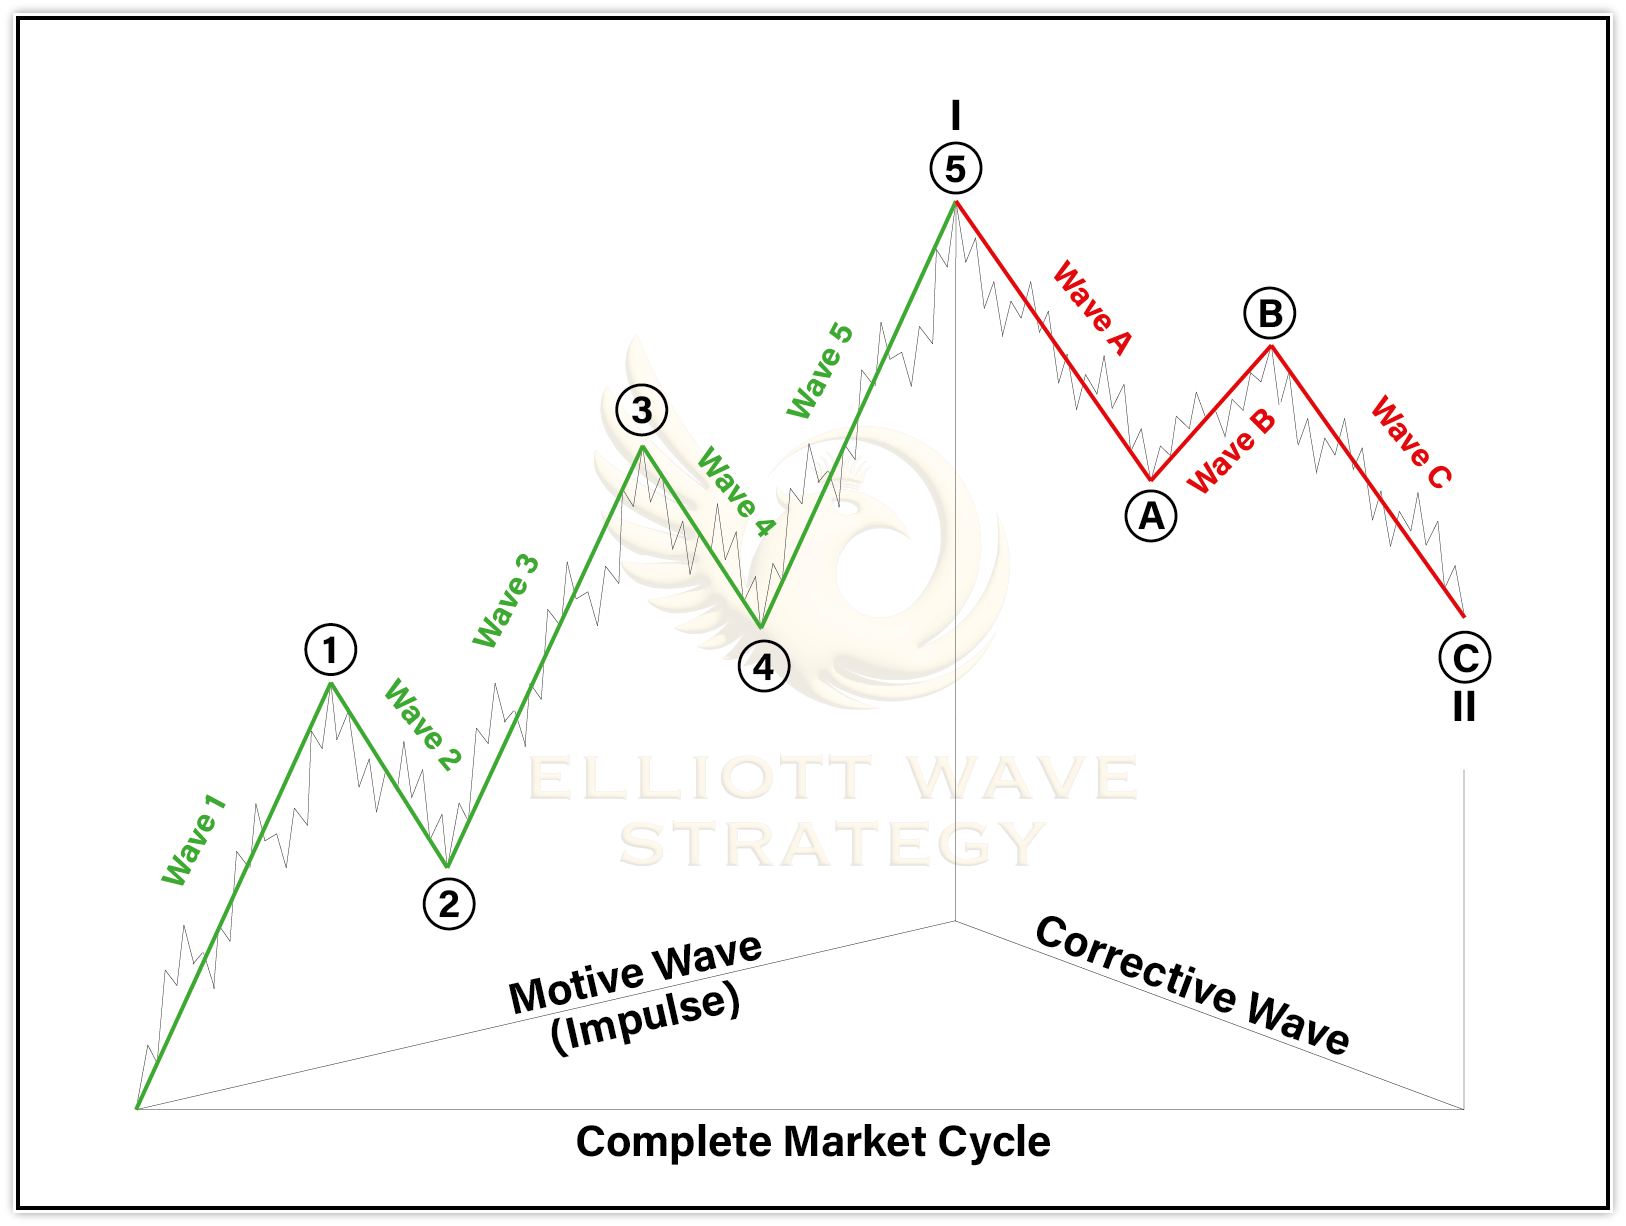
Wave structures in Elliott Wave Theory are divided into impulse waves and corrective waves. Impulse Waves are labeled 1, 2, 3, 4, 5, where Waves 1, 3, and 5 move in the direction of the primary trend, while Waves 2 and 4 are smaller corrections. Corrective Waves are labeled A, B, C, representing the pullback after a 5-wave impulse completes.
If Wave 2 is a sharp zigzag correction, Wave 4 may often form a sideways or more complex pattern (like a flat or triangle). This alternation helps traders anticipate the type of correction likely to appear.
Wave 1 often marks a shift in market sentiment. Wave 2 retraces part of Wave 1-common retracement levels include 50% or 61.8%. Wave 3 is typically the longest and most explosive wave. Wave 4 tends to be shallower than Wave 2 and should not overlap Wave 1’s price territory. Wave 5 is the final push, sometimes accompanied by momentum divergence.
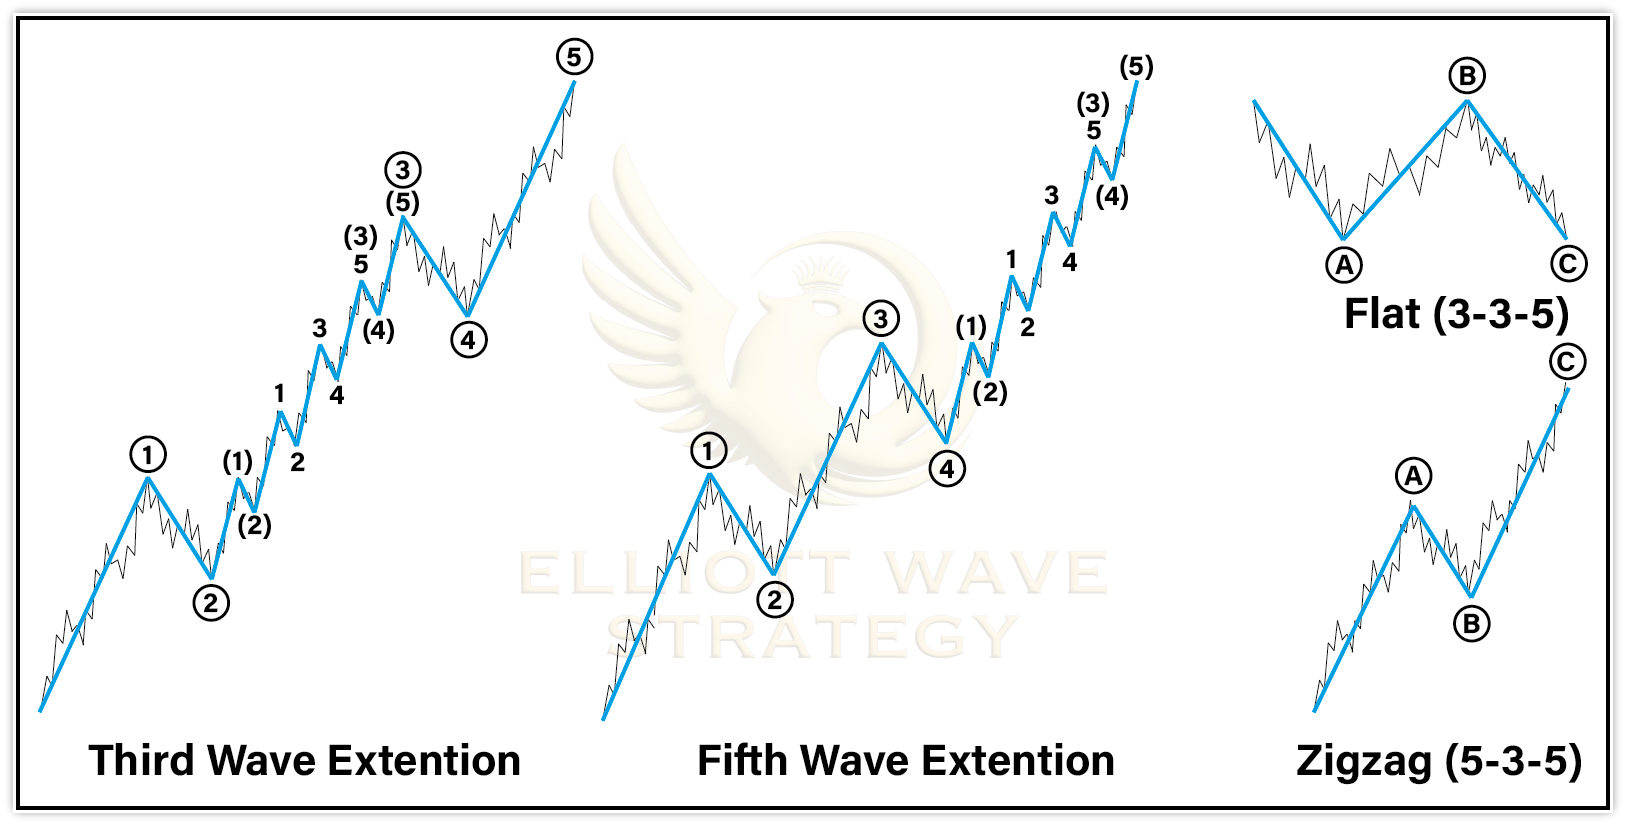
A typical correction is labeled A-B-C. Wave A is the first move against the preceding trend. Wave B partially retraces Wave A. Wave C concludes the correction and often extends beyond Wave A. Beyond standard A-B-C, corrections can form zigzags, flats, triangles, or even combinations like double or triple threes.
Degrees of Trend
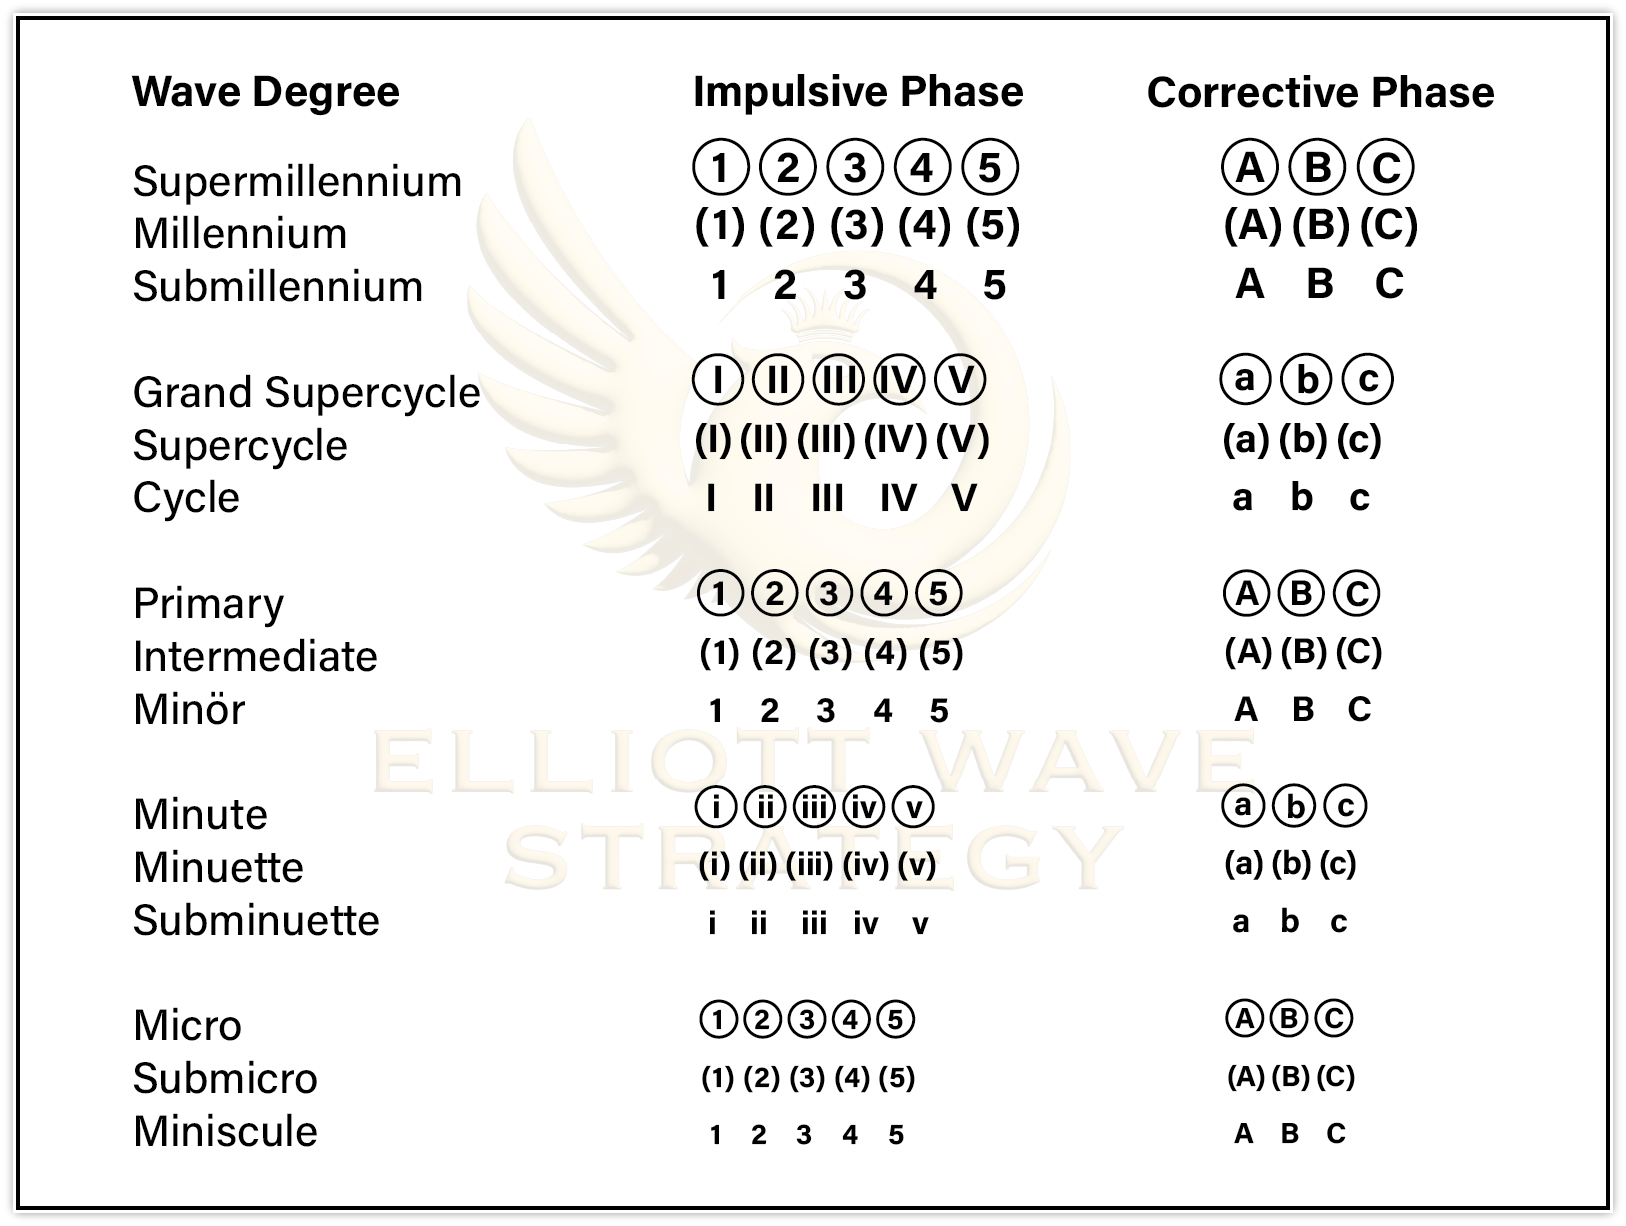
Elliott Waves exist on multiple degrees: Grand supercycle, supercycle, cycle, primary, intermediate, minor, minute, and more. A wave on the minor degree might be part of a larger wave on the intermediate degree, which itself could be part of a giant cycle wave.
For practical trading purposes, the most commonly used degrees are: Primary (spanning months to years), Intermediate (spanning weeks to months), Minor (spanning days to weeks), Minute (spanning hours to days). Understanding which degree you’re analyzing is crucial for setting appropriate profit targets and stop-loss levels.
The Role of Fibonacci
Elliott Wave Theory is deeply intertwined with Fibonacci mathematics. Elliott noticed that waves tend to relate to one another through Fibonacci ratios. Wave 2 most commonly retraces 50% or 61.8% of Wave 1. Wave 3 most commonly extends to 161.8% of Wave 1. Wave 4 most commonly retraces 38.2% of Wave 3. Wave 5 most commonly equals Wave 1 in length.
Fibonacci retracement and extension levels provide specific price targets for wave completions, giving traders objective entry and exit points rather than relying purely on subjective pattern recognition.
Common Terms in Elliott Wave Theory
As you dive deeper into Elliott Wave analysis, you’ll encounter several recurring terms: Extension-when one of the motive waves (usually Wave 3) is significantly longer than the others, often stretching to 161.8% or 261.8% of the preceding wave. Truncation-when Wave 5 fails to move beyond the end of Wave 3, signaling exhaustion of the trend.
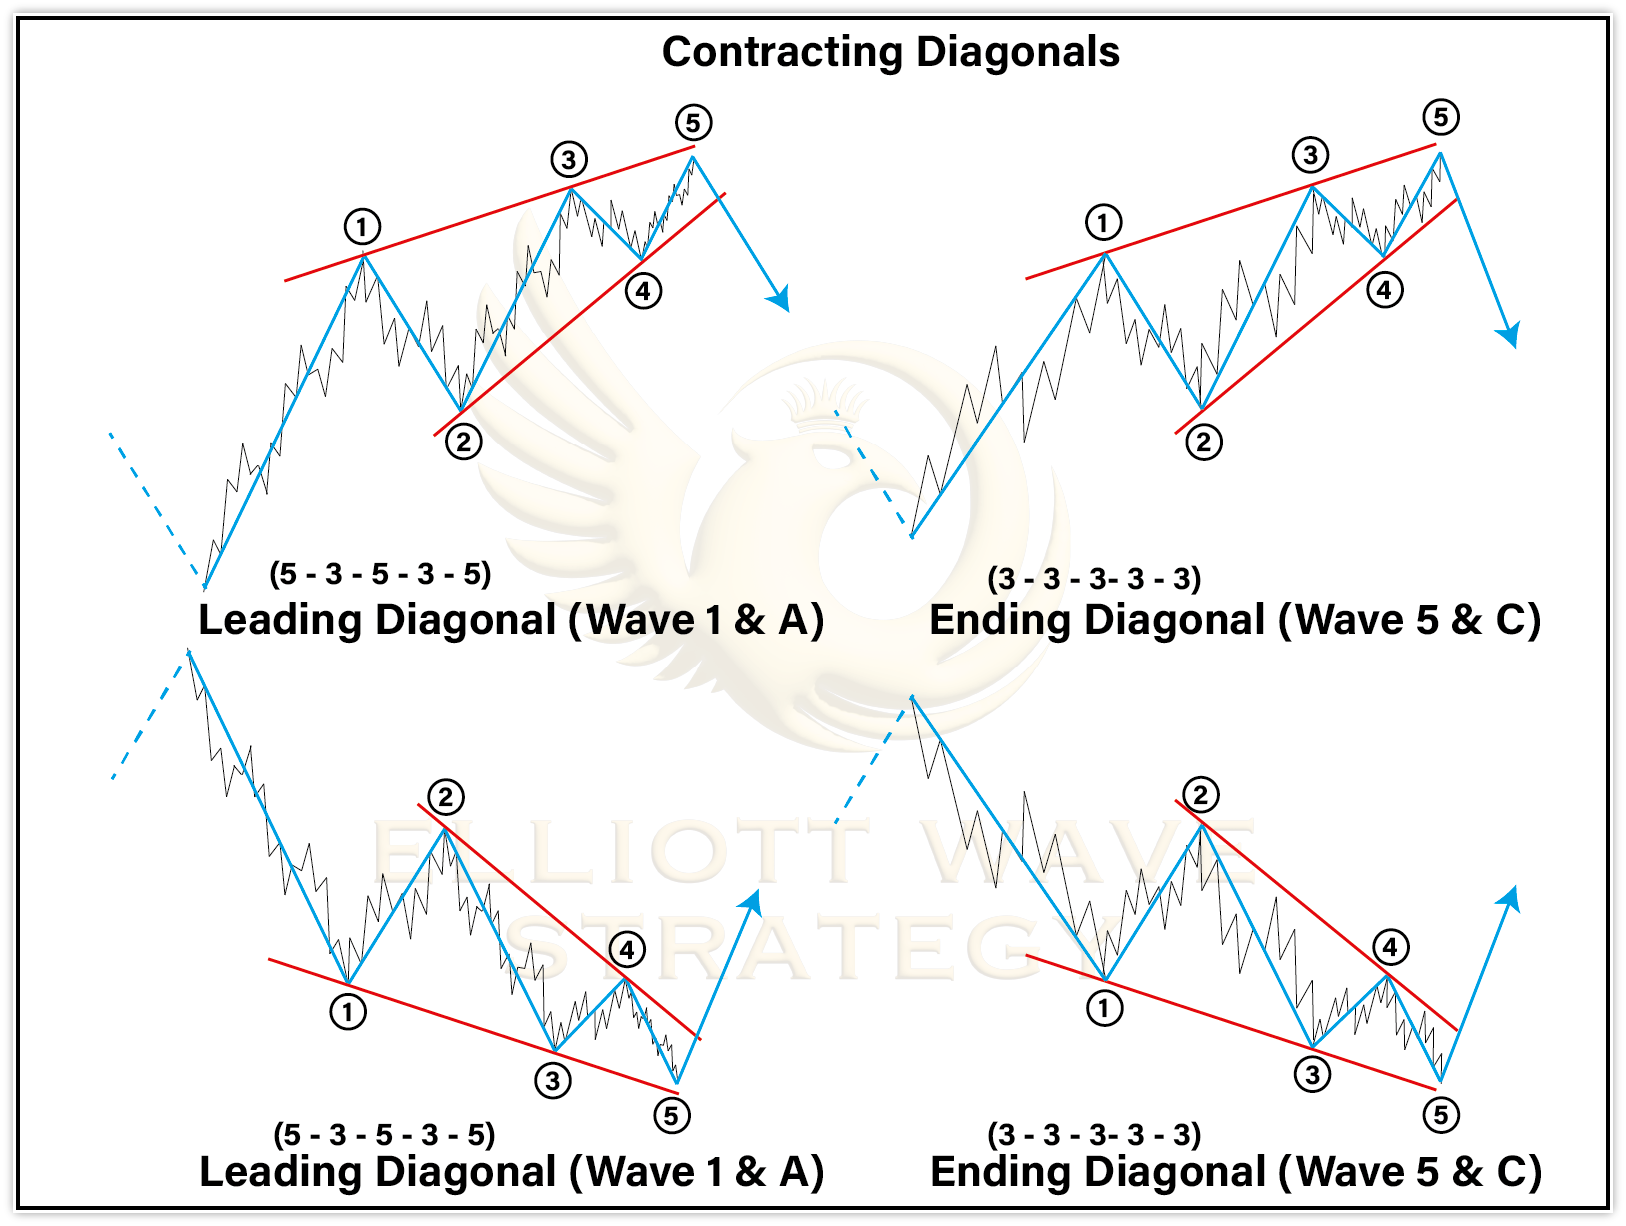
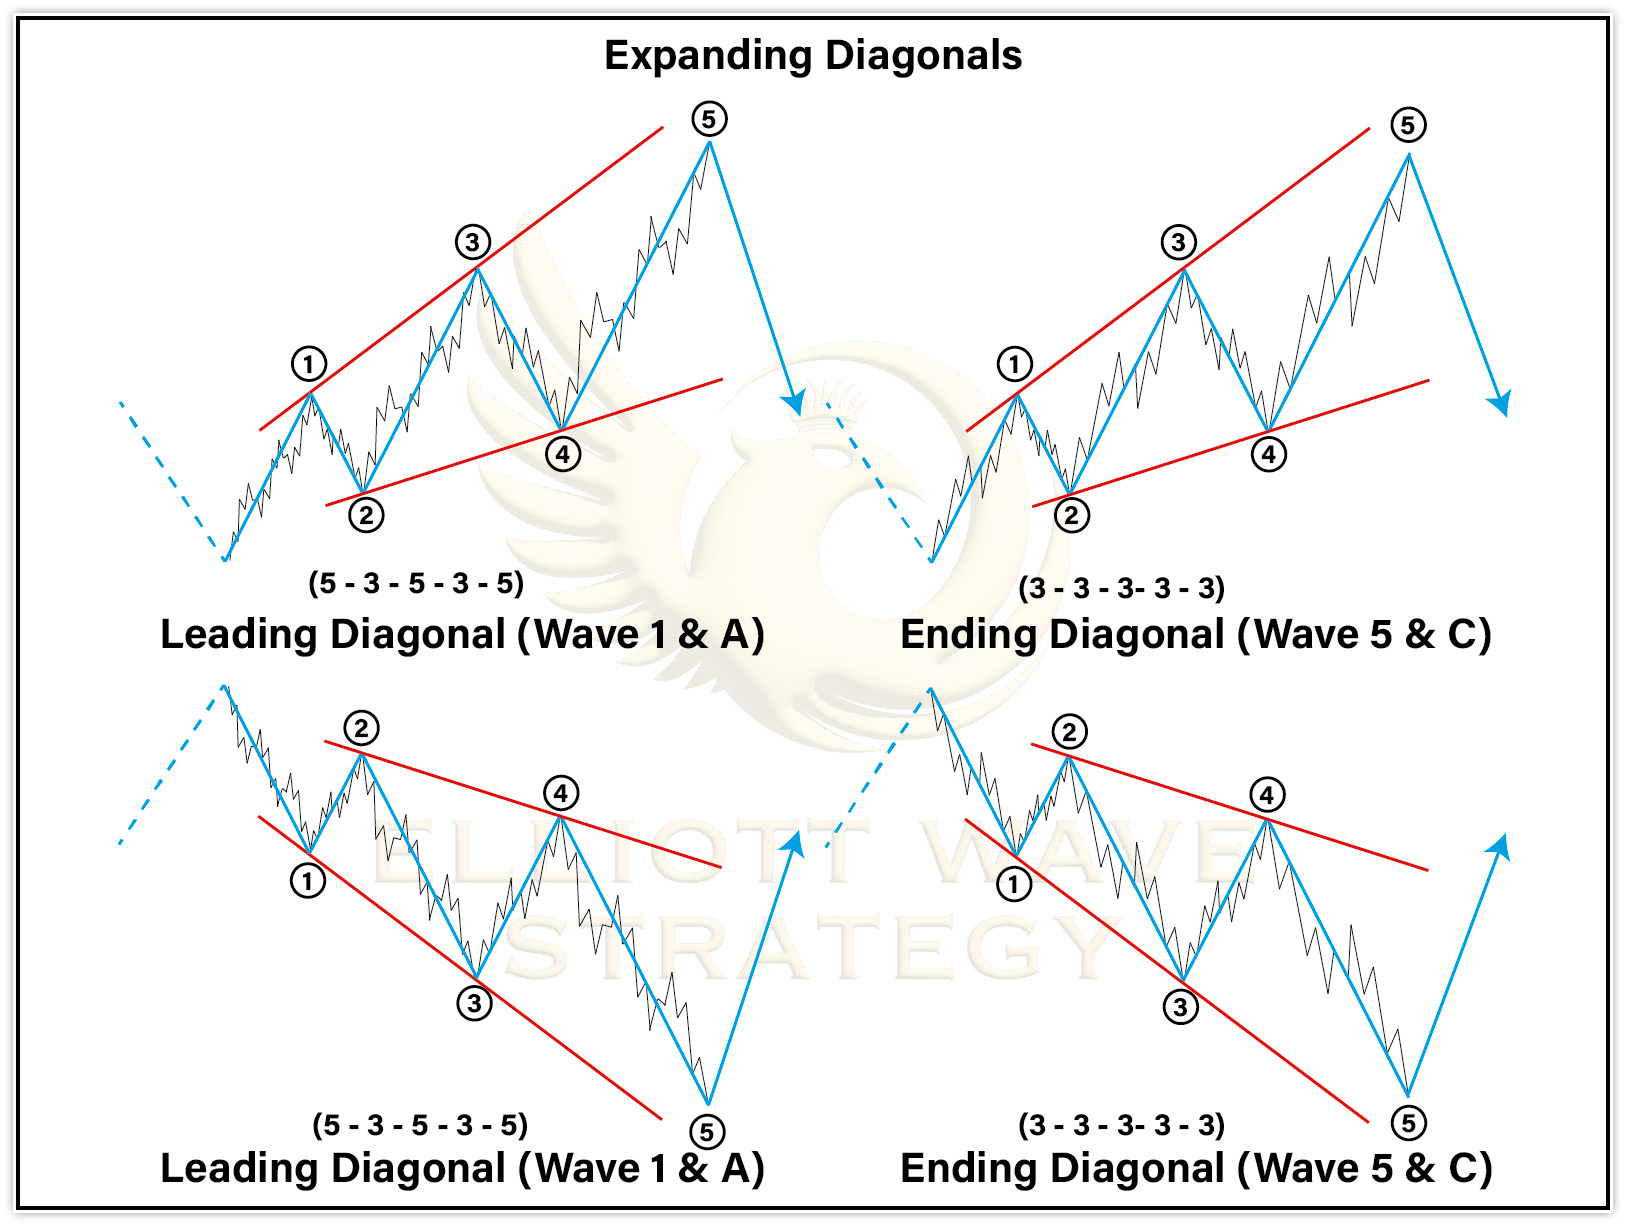
Diagonal-a variation of the impulse wave where the waves overlap, often seen at the beginning or end of a trend. Flat-a corrective pattern where Wave B retraces most of Wave A. Zigzag-a sharp corrective pattern labeled A-B-C where Wave C equals Wave A in length. Triangle-a 5-leg corrective pattern labeled A-B-C-D-E, usually signaling a continuation of the main trend.
How Elliott Wave Works in Trading
In practical trading, Elliott Wave Theory is used to identify the current position within a wave sequence and anticipate future price movements. If the market has completed Waves 1 and 2, a trader might enter long at the start of Wave 3-the longest and most powerful wave-with a stop below the start of Wave 1.
Key applications include: identifying high-probability entry points (e.g., the start of Wave 3 or Wave 5); setting profit targets using Fibonacci extensions; placing stop-losses at wave invalidation points; anticipating corrections after impulsive moves.
Elliott Wave counts define logical “invalidation points.” For example, if you expect a Wave 3 uptrend but price falls below the start of Wave 1, you know your analysis was incorrect, and it’s time to cut losses. Many traders merge Elliott Wave with candlestick patterns, volume analysis, or fundamental drivers for extra confirmation.
The Advantages of Elliott Wave Analysis
Elliott Wave Theory offers several unique advantages: It provides a complete market framework-rather than just identifying trends, it tells you where you are within the broader cycle. It defines clear invalidation levels for objective stop-loss placement. It works on all timeframes and markets due to its fractal nature.
Each wave encapsulates a dominant emotional theme: from early disbelief in Wave 1 to fervent optimism in Wave 3, eventually to exhaustion in Wave 5. Understanding these emotional undercurrents can help traders gauge overall market sentiment.
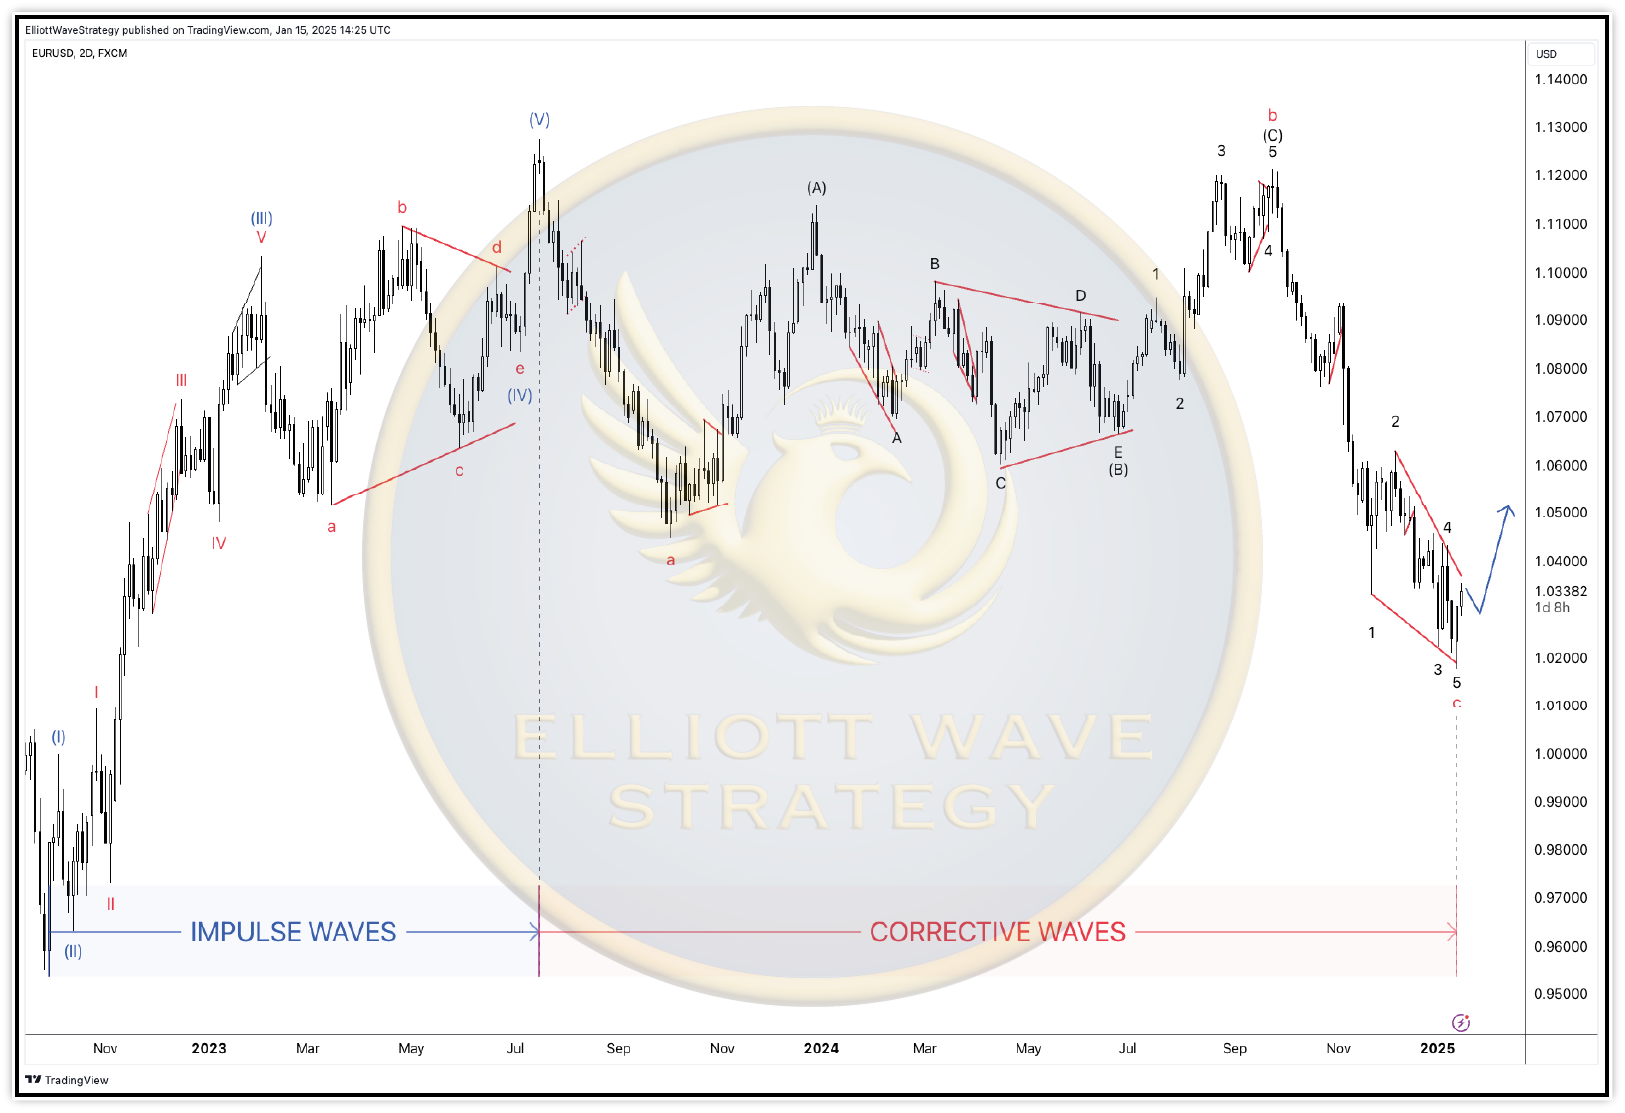
Elliott Wave applies to stocks, forex, commodities, and cryptocurrencies-wherever crowd psychology is at play. The fractal nature means it works on multiple timeframes-weekly, daily, hourly, or even tick charts.
The Limitations of Elliott Wave Analysis
Despite its power, Elliott Wave Theory comes with significant challenges: Subjectivity-different analysts can identify different wave counts on the same chart. Complexity-learning to accurately label waves takes considerable time and practice. Real-time difficulty-identifying which wave you’re in while it’s forming is inherently challenging.
Elliott Wave works best when combined with other tools (RSI, volume, Fibonacci) rather than used in isolation. Like all forms of technical analysis, EWT provides probabilities, not certainties. If price action deviates significantly from your initial count, accept it and re-evaluate.
Advanced Concepts
As traders advance in their Elliott Wave studies, they encounter more nuanced patterns. Diagonal waves are five-wave structures where the sub-waves overlap, giving the pattern a wedge-like appearance. Leading Diagonals appear as Wave 1 or Wave A and indicate the start of a new trend. Ending Diagonals appear as Wave 5 or Wave C and signal exhaustion of the trend-often followed by sharp reversals.
Other advanced concepts include wave extensions (where one of the motive waves becomes much longer than the others), wave truncations (where Wave 5 fails to exceed Wave 3), and complex corrective patterns like double threes (W-X-Y) and triple threes (W-X-Y-X-Z).
Using Elliott Wave with Other Indicators
Elliott Wave Theory is most powerful when combined with complementary analytical tools. RSI Divergence-bearish divergence at a Wave 5 high confirms the end of a move; bullish divergence at Wave 2 lows confirms support. Volume Analysis-volume typically peaks during Wave 3 and diminishes during Wave 5.
MACD crossovers and histogram divergences can confirm wave transitions. Fibonacci retracements and extensions provide precise price targets. Multi-timeframe analysis-aligning wave counts across multiple timeframes significantly increases the probability of a successful trade.
Since its formalization in the 1930s, Elliott Wave has been tested in bull and bear cycles, market crashes, and booms. Its core premise remains robust.
Conclusion
The Basics of Elliott Wave Theory provide a structured lens through which to interpret market movements. By recognizing that prices move in impulse waves (driven by strong sentiment) and corrective waves (where the market digests gains or losses), traders gain a predictive edge.
For beginners, the learning curve can feel steep, but consistent practice-labeling waves on historical charts, understanding Fibonacci retracements, and combining Elliott Wave with other analytical tools-fosters skill development. Whether you trade stocks, forex, commodities, or cryptocurrencies, Elliott Wave Theory can help you plan entries, exits, and risk management with greater precision.
Remember that flexibility and revision are integral to Elliott Wave analysis. No single method can guarantee profits, but the disciplined application of Elliott Wave can significantly elevate your understanding of market dynamics.