
Mastering Impulse Waves
Impulse waves are the engine of trending markets. They represent the moments when crowd psychology aligns in one direction, creating the powerful directional moves that offer the highest-probability trading opportunities. Mastering the identification and trading of impulse waves is the single most valuable skill an Elliott Wave practitioner can develop.
Key Features of Impulse Waves
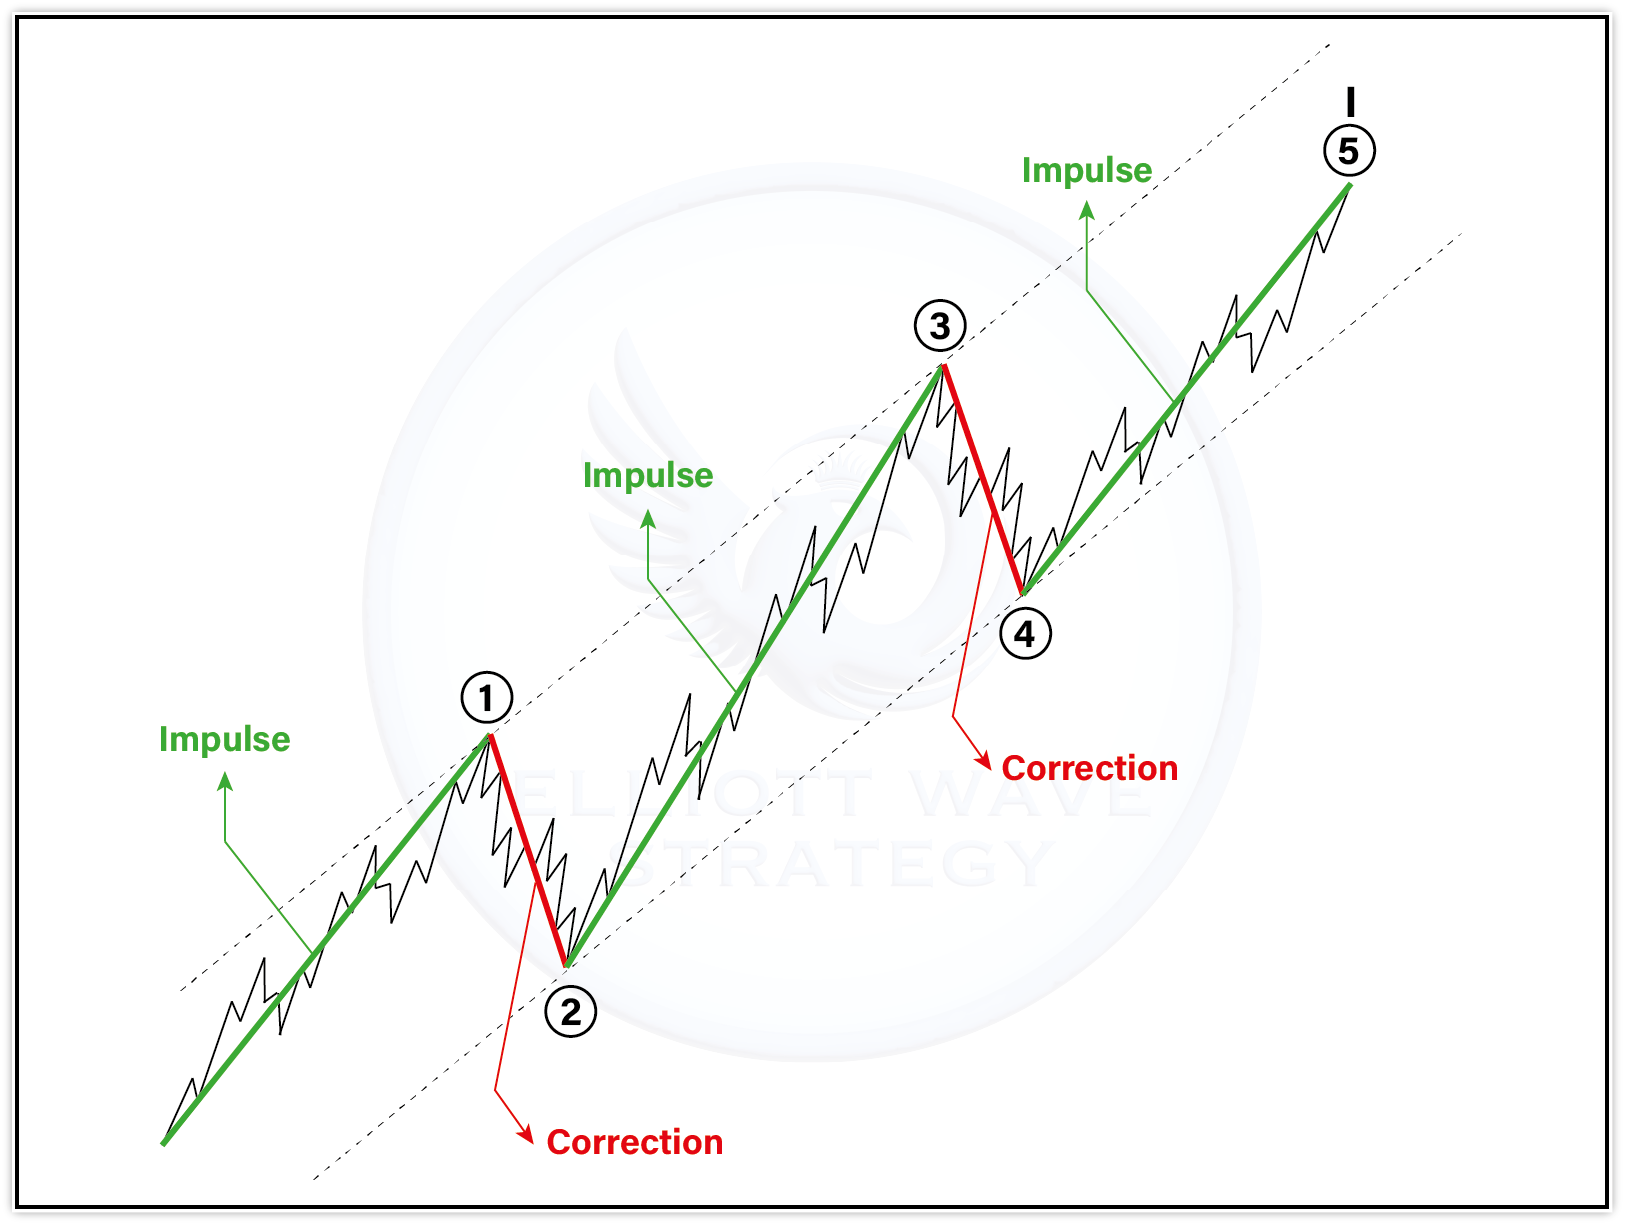
A valid impulse wave consists of five waves (1-2-3-4-5) with waves 1, 3, and 5 moving in the trend direction. It obeys all three cardinal rules. Wave 3 is typically the longest and most powerful. Wave 2 and Wave 4 alternate in character (sharp vs. sideways). The overall structure shows clear directional momentum.
Impulse waves appear at every degree of trend-from multi-year primary waves on monthly charts to hour-long minute waves on 5-minute charts. The same identifying characteristics apply at all degrees.
Rules and Guidelines
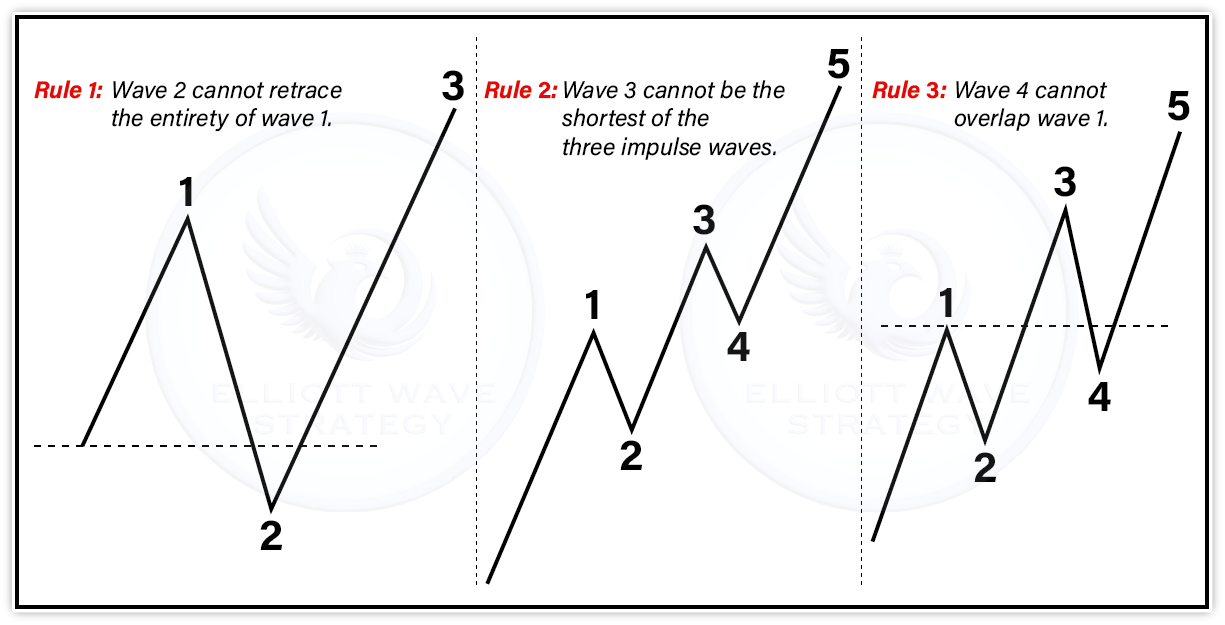
Three rules are absolute: Rule 1-Wave 2 cannot retrace more than 100% of Wave 1. Rule 2-Wave 3 cannot be the shortest of Waves 1, 3, and 5. Rule 3-Wave 4 cannot overlap Wave 1’s price territory in a standard impulse.
Guidelines (common tendencies): Wave 2 often retraces 61.8% of Wave 1. Wave 3 often extends to 161.8% of Wave 1. Wave 4 often retraces 38.2% of Wave 3. Waves 2 and 4 tend to alternate in form (if Wave 2 is a sharp zigzag, Wave 4 tends to be a flat or triangle).
Common Impulse Formations
While all impulse waves follow the same rules, they appear in several forms: Standard Impulse-the most common, with Wave 3 as the extended wave. Extended Third Wave-Wave 3 extends dramatically, often reaching 261.8% of Wave 1; the most powerful and profitable formation.
Extended Fifth Wave-Wave 5 extends beyond normal expectations; often ends with RSI divergence. Terminal Impulse (Ending Diagonal)-a wedge-shaped impulse where Wave 4 overlaps Wave 1; signals exhaustion of the trend.
Impulse vs. Corrective Waves
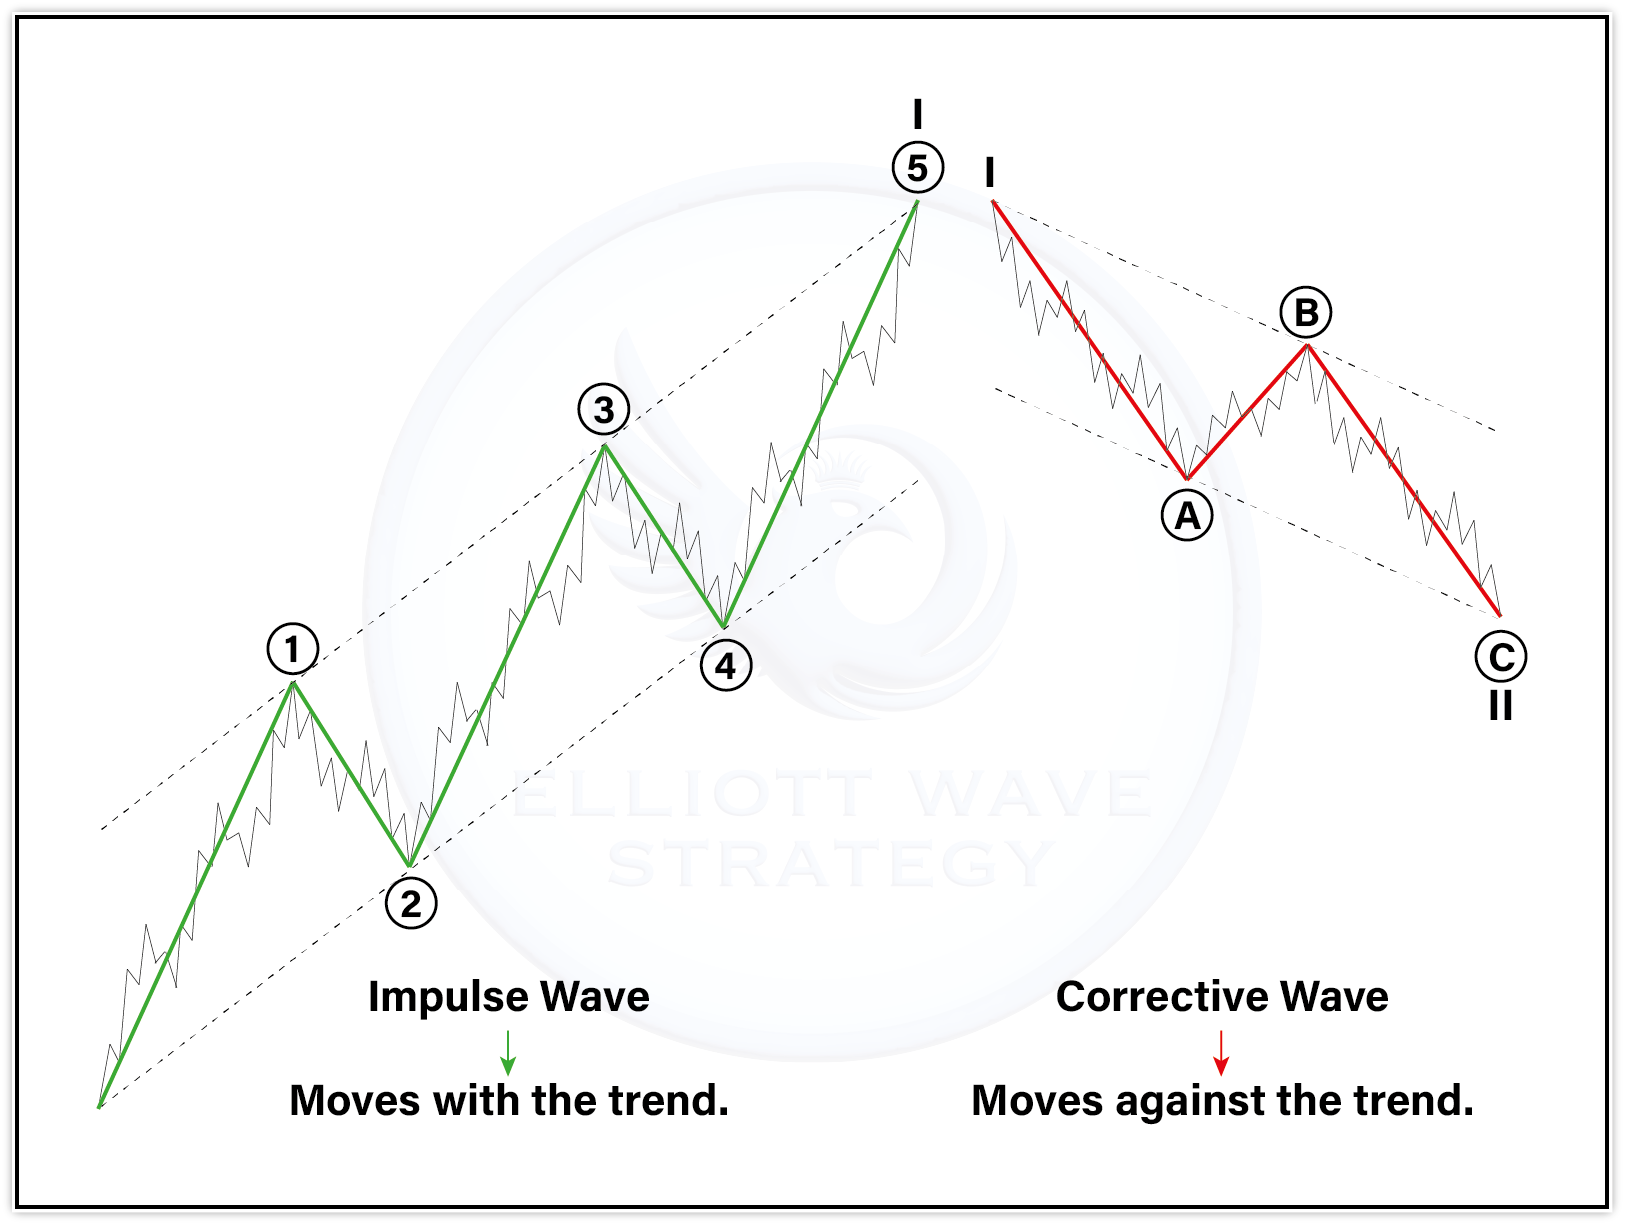
Key differences: Impulse waves show clear directional momentum; corrective waves are choppy and overlapping. Impulse waves subdivide into five waves; corrective waves subdivide into three. In impulse waves, Wave 4 does not overlap Wave 1; in corrective waves, overlap is common.
Practical rule: if you’re seeing overlapping waves, sideways chop, and lack of directional momentum-you’re in a correction. If you’re seeing clean directional moves with clear wave structure and no overlap-you’re in an impulse.
Predicting Market Moves
Once Wave 2 has completed, a trader can project: Wave 3 target (161.8% extension of Wave 1); Wave 3 maximum extension (261.8% or 423.6% if extended); Wave 4 retracement zone (38.2% of Wave 3); Wave 5 target (equal to Wave 1, from Wave 4 low).
This provides a complete roadmap of the entire five-wave sequence before it completes-allowing traders to plan entries, partial exits, and final exits in advance.
Trade Entry Signals
The three highest-probability entries: Wave 2 Entry-enter at the end of Wave 2 with stop below Wave 1 origin, targeting Wave 3 (161.8%). This is the highest risk-reward entry. Wave 4 Entry-enter at Wave 4’s end with stop below Wave 1 high, targeting Wave 5.
For all entries: confirm with RSI (look for divergence at wave extremes), check volume (should be highest in Wave 3), and confirm Fibonacci alignment (entry price at a Fibonacci retracement level).
Timing Trades with Impulse Waves
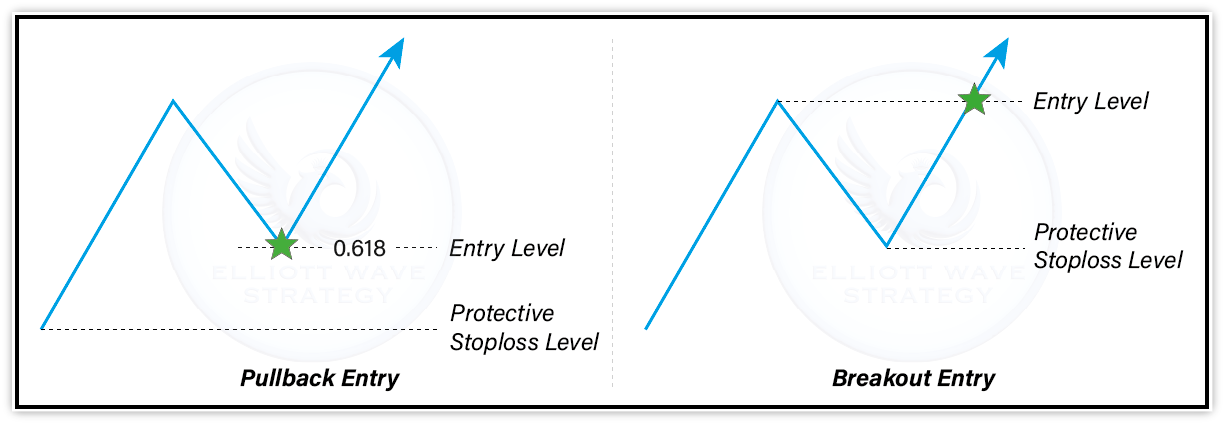
The ideal entry is at the precise completion of a corrective wave (Wave 2 or Wave 4), not during the impulse itself. Wait for the correction to complete before entering-entering during an ongoing correction risks buying into further downside.
Signs that a correction is completing: RSI reaches oversold; price reaches key Fibonacci retracement (50% or 61.8% for Wave 2; 38.2% for Wave 4); corrective wave shows its own completion pattern; volume dries up during correction and expands on the first reversal candle.
Indicators for Spotting Impulse Waves
RSI should show higher highs in Wave 3 vs. Wave 1 (momentum expansion); may show lower highs in Wave 5 vs. Wave 3 (divergence-exhaustion signal). MACD histogram should peak during Wave 3; declining in Wave 5 warns of exhaustion.
Volume should expand during Waves 1, 3, and 5 and contract during Waves 2 and 4. ATR tends to expand during Wave 3 (highest volatility) and contract during Wave 4.
Mistakes in Impulse Wave Analysis
The most common mistakes: Counting a three-wave move as five waves; Ignoring the Wave 4/Wave 1 overlap rule; Labeling every strong move as Wave 3 without confirming overall context; Missing Wave 2 and entering too late during Wave 3.
Impatient traders often miss the best entry (Wave 2 low) and enter during Wave 3, accepting a worse risk/reward ratio. Discipline to wait for the correction to complete is essential.
Conclusion
Mastering impulse waves is the foundation of profitable Elliott Wave trading. The five-wave structure-with its clear rules, Fibonacci relationships, and characteristic momentum signature-provides some of the most reliable trade setups available.
Focus on identifying Wave 2 completions for the highest risk-reward entries, confirm with Fibonacci retracement levels and RSI, and always respect the cardinal rules as absolute boundaries for your wave counts.