
Corrective Waves Analysis
Corrective waves are the most challenging aspect of Elliott Wave Theory. Unlike the straightforward five-wave impulse structure, corrections come in dozens of variations-each with different rules, typical characteristics, and trading implications. Yet mastering corrective wave analysis is essential: corrections define entry points, set stop-loss levels, and determine how much of the prior trend will be retraced.
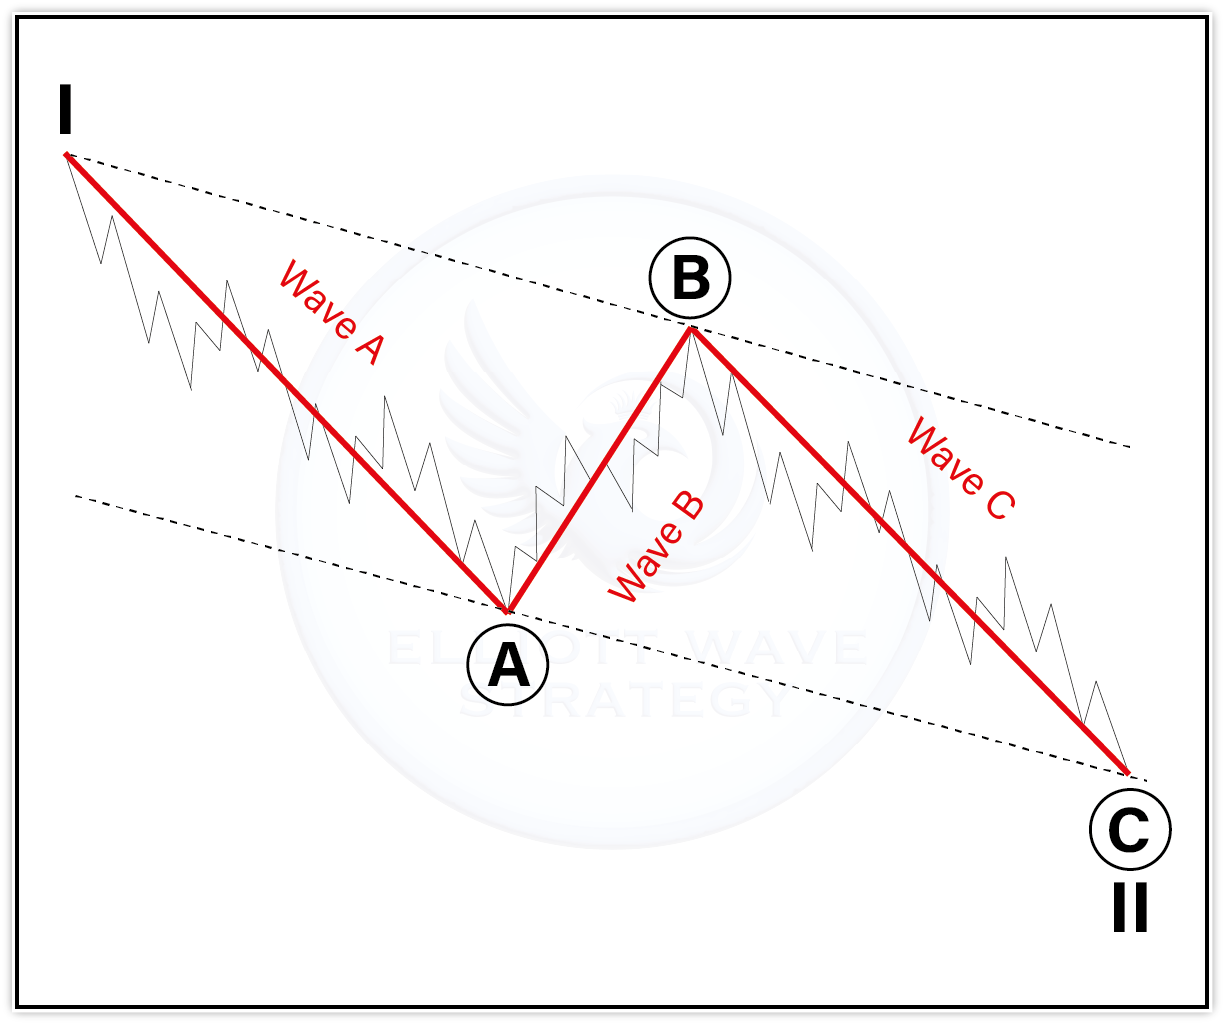
Why Corrective Waves Matter
Corrections represent the market ‘digesting’ prior gains or losses. They shake out weak hands, reset momentum indicators, and build the base from which the next impulse wave launches.
Understanding corrections is critical because: They define the best entry points for trend-following trades. They determine how deep a retracement to expect. They warn when a correction is becoming too deep and the original trend may be wrong.
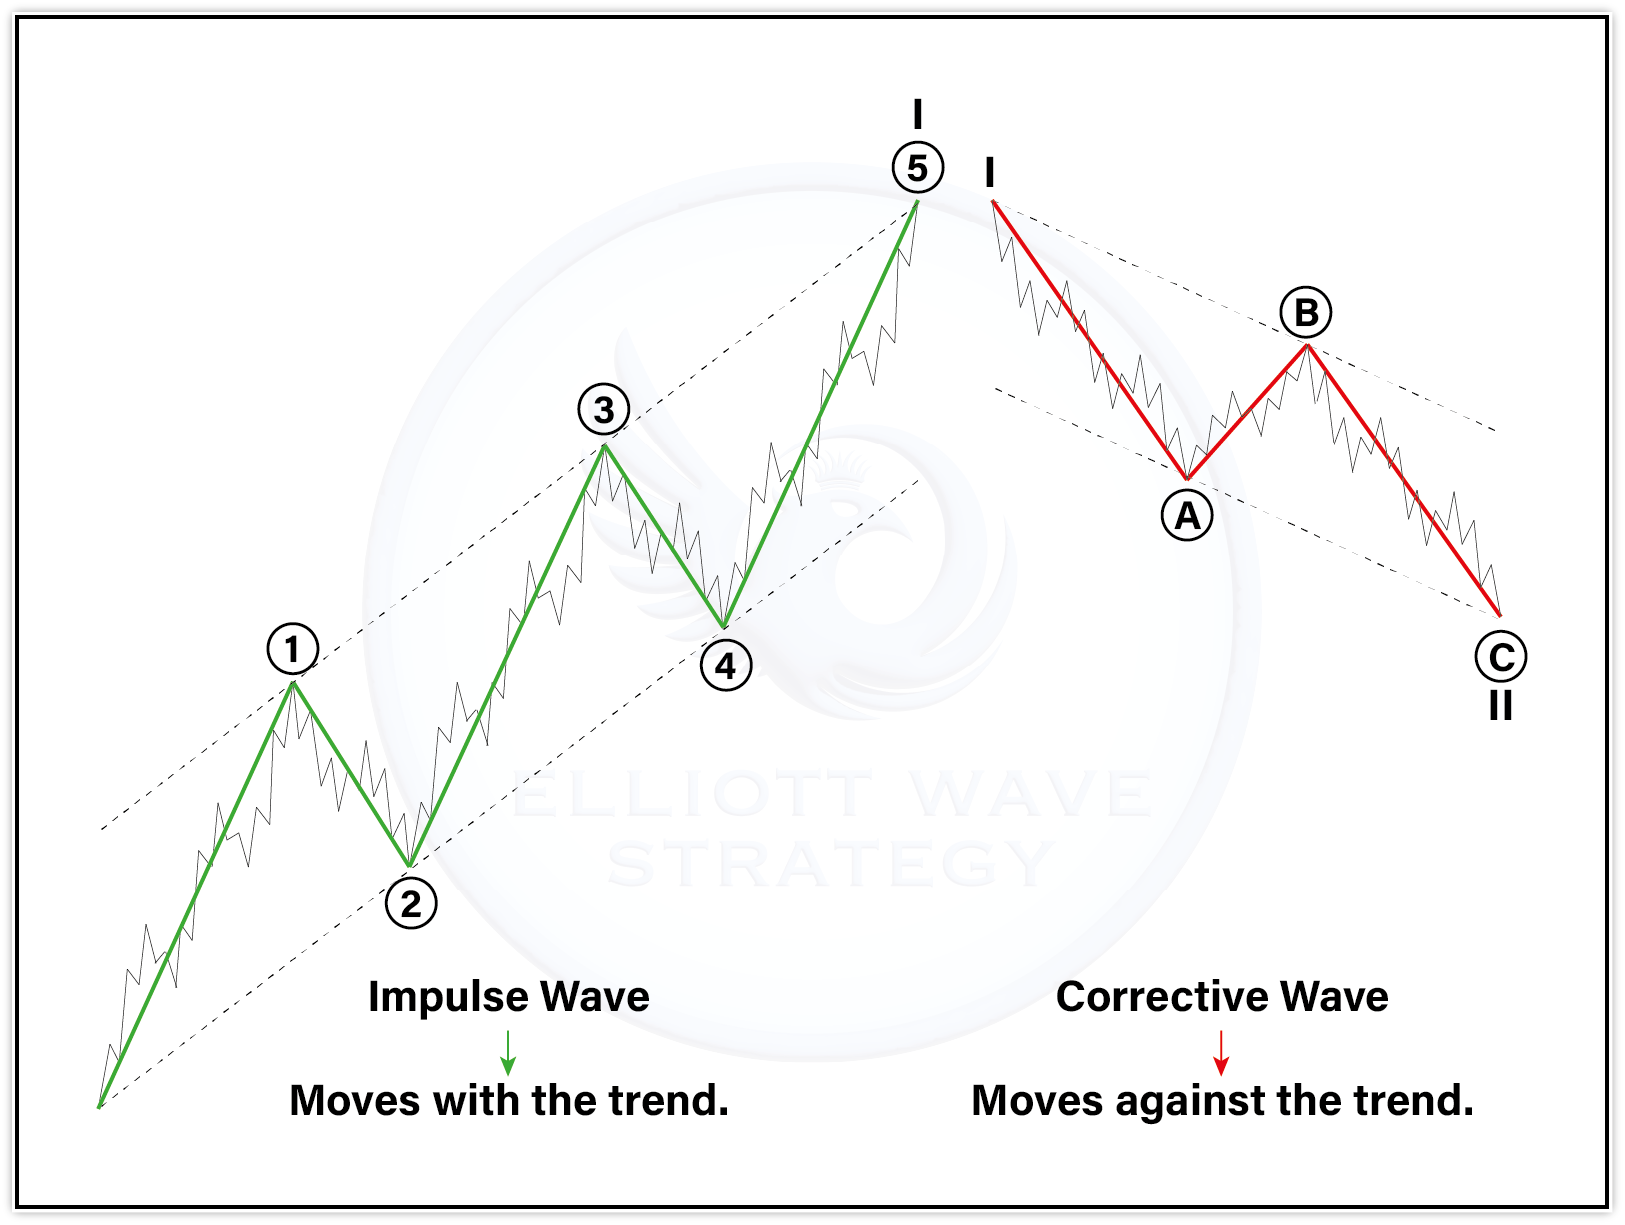
Types of Corrective Waves
Four main categories: Zigzag (5-3-5)-the sharpest pattern; most common for Wave 2. Wave C typically equals Wave A. Flat (3-3-5)-a sideways correction; most common for Wave 4. Wave B retraces most of Wave A; comes in regular, expanded, and running varieties.
Triangle (3-3-3-3-3)-five overlapping waves in a converging channel. Most common for Wave 4 or Wave B. The breakout (thrust) moves sharply in the direction of the prior trend. Complex Correction (W-X-Y)-two or three simple patterns linked by X waves. The most difficult to identify and trade.
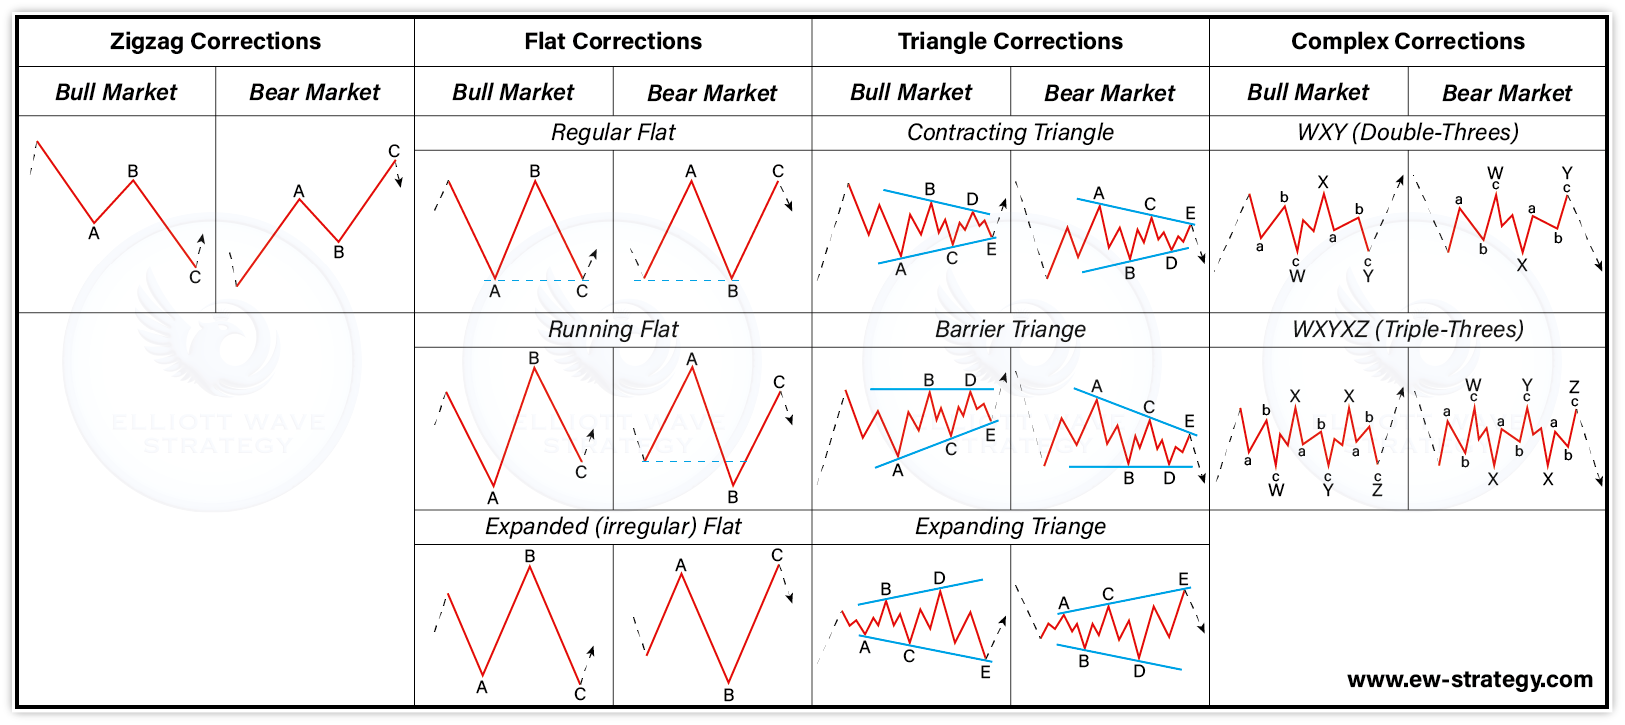
Key Features of Each Correction Type
Zigzag features: Sharp, deep retracement (often 50%–62%); A and C waves are both five-wave structures; B wave retraces only 38%–62% of A. Flat features: Sideways, contained price action; B wave retraces 90%–105% of A (regular) or exceeds A (expanded).
Triangle features: Five sub-waves that alternate direction in a converging pattern; Volume diminishes as the triangle develops; a sharp breakout follows completion. Duration is often longer than simpler corrections.
Identifying Corrective Patterns
The key is counting internal sub-waves. A sharp three-wave move that subdivides into 5-3-5 is a zigzag. A sideways three-wave move where B nearly retraces all of A is a flat. A five-wave overlapping structure with converging boundaries is a triangle.
When sub-wave counting is ambiguous, Fibonacci ratios can confirm: Zigzag-C = 100% of A; Flat-C = 100%–123.6% of A; Triangle-each wave = 61.8% of the prior wave. If nothing fits, it may be a complex correction (W-X-Y).
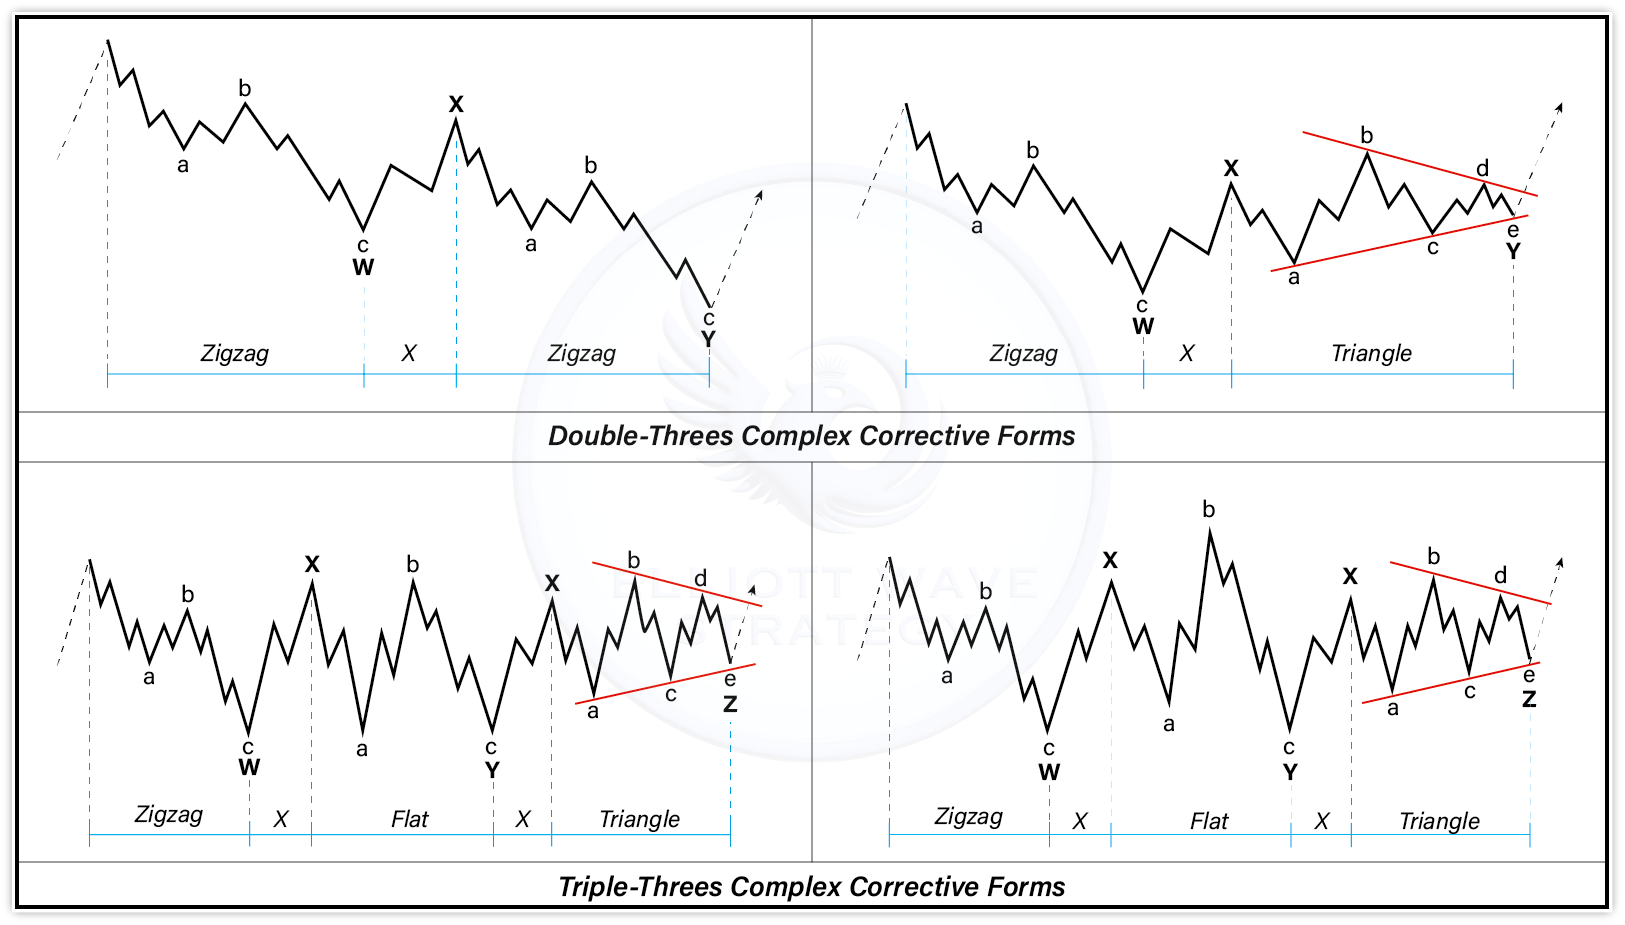
Complex Corrections (W-X-Y)
Complex corrections are two or three simple corrective patterns connected by X waves. The most common is the double three (W-X-Y): W is a simple correction; X is a brief counter-trend move; Y is another simple correction.
X waves are often the most misleading-they can appear to be the start of a new impulse when they’re actually just connecting waves within a complex correction. The key tell: X waves are always three-wave structures.
Predicting Corrective Wave Endpoints
Fibonacci ratios provide reliable guidance: Wave 2 (typically zigzag): reversal near 50%–61.8% retracement of Wave 1. Wave 4 (typically flat or triangle): reversal near 38.2% retracement of Wave 3. Wave B (in zigzag): 38.2%–61.8% of Wave A. Wave C (in zigzag): most commonly equals Wave A (100%).
The guideline of alternation also helps: if Wave 2 was a deep zigzag, Wave 4 will tend to be a shallow flat or triangle, and vice versa.
Trading Strategies for Corrections
The preferred strategy: waiting for the correction to complete, then entering in the direction of the larger trend at the correction low. Wait for signs of completion: five waves down in a zigzag C wave; RSI divergence at the C wave low; price reaching key Fibonacci support.
Enter the trend-following trade with a stop just below the correction low. This is lower risk and the most reliable application of corrective wave analysis.
Correction Completion Signals
For zigzags: Wave C should show five sub-waves; look for RSI divergence at Wave C completion. For flats: Wave C ends near Wave A’s endpoint; look for reversal candle patterns. For triangles: after the E wave completes, the thrust follows immediately; enter on the first breakout candle.
Universal signals: volume dries up at correction lows; RSI reaches oversold; price reaches Fibonacci support level.
Avoiding Common Mistakes
Calling a correction complete too early-corrections often extend further than expected. Misidentifying the correction type-let the B wave determine which type is forming. Ignoring alternation-if Wave 2 was a zigzag, expect a flat or triangle for Wave 4.
Trading against the larger trend in a complex correction-complex corrections can last much longer than expected. Be cautious about counter-trend trades within them.
Conclusion
Corrective waves are where most traders struggle-and where mastery creates the greatest edge. The ability to correctly identify the correction type, project its likely endpoint using Fibonacci ratios, and time the entry into the subsequent impulse is the hallmark of an advanced practitioner.
At EW Strategy, our reports always include the specific correction type in progress, its Fibonacci completion targets, and the trigger we’re watching to confirm the correction is over and the next impulse has begun.