
Fibonacci Ratios in Wave Analysis
Fibonacci mathematics and Elliott Wave Theory are inseparable. R.N. Elliott himself recognized that wave relationships consistently reflect Fibonacci ratios, and Robert Prechter further codified these relationships. Understanding how Fibonacci ratios govern wave lengths and retracements is essential for setting precise price targets and identifying high-probability trade setups.
Fibonacci Levels in Wave Counting
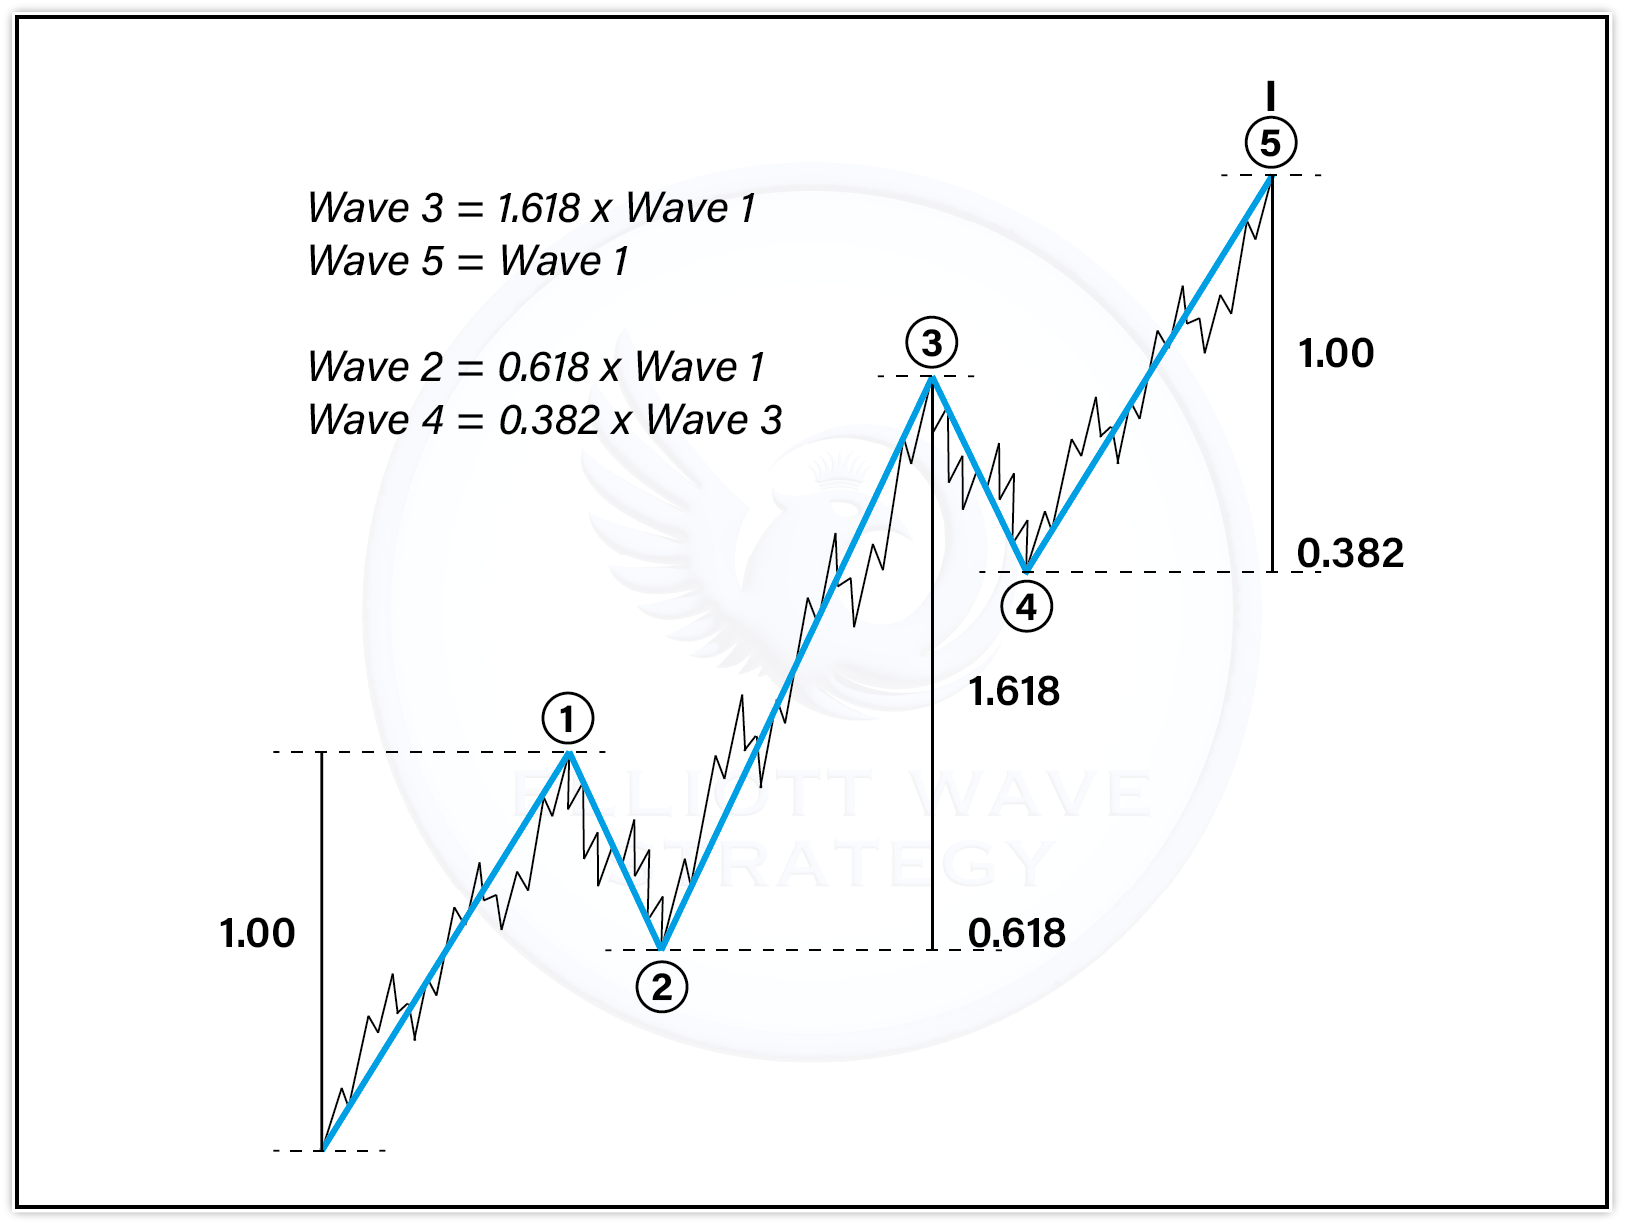
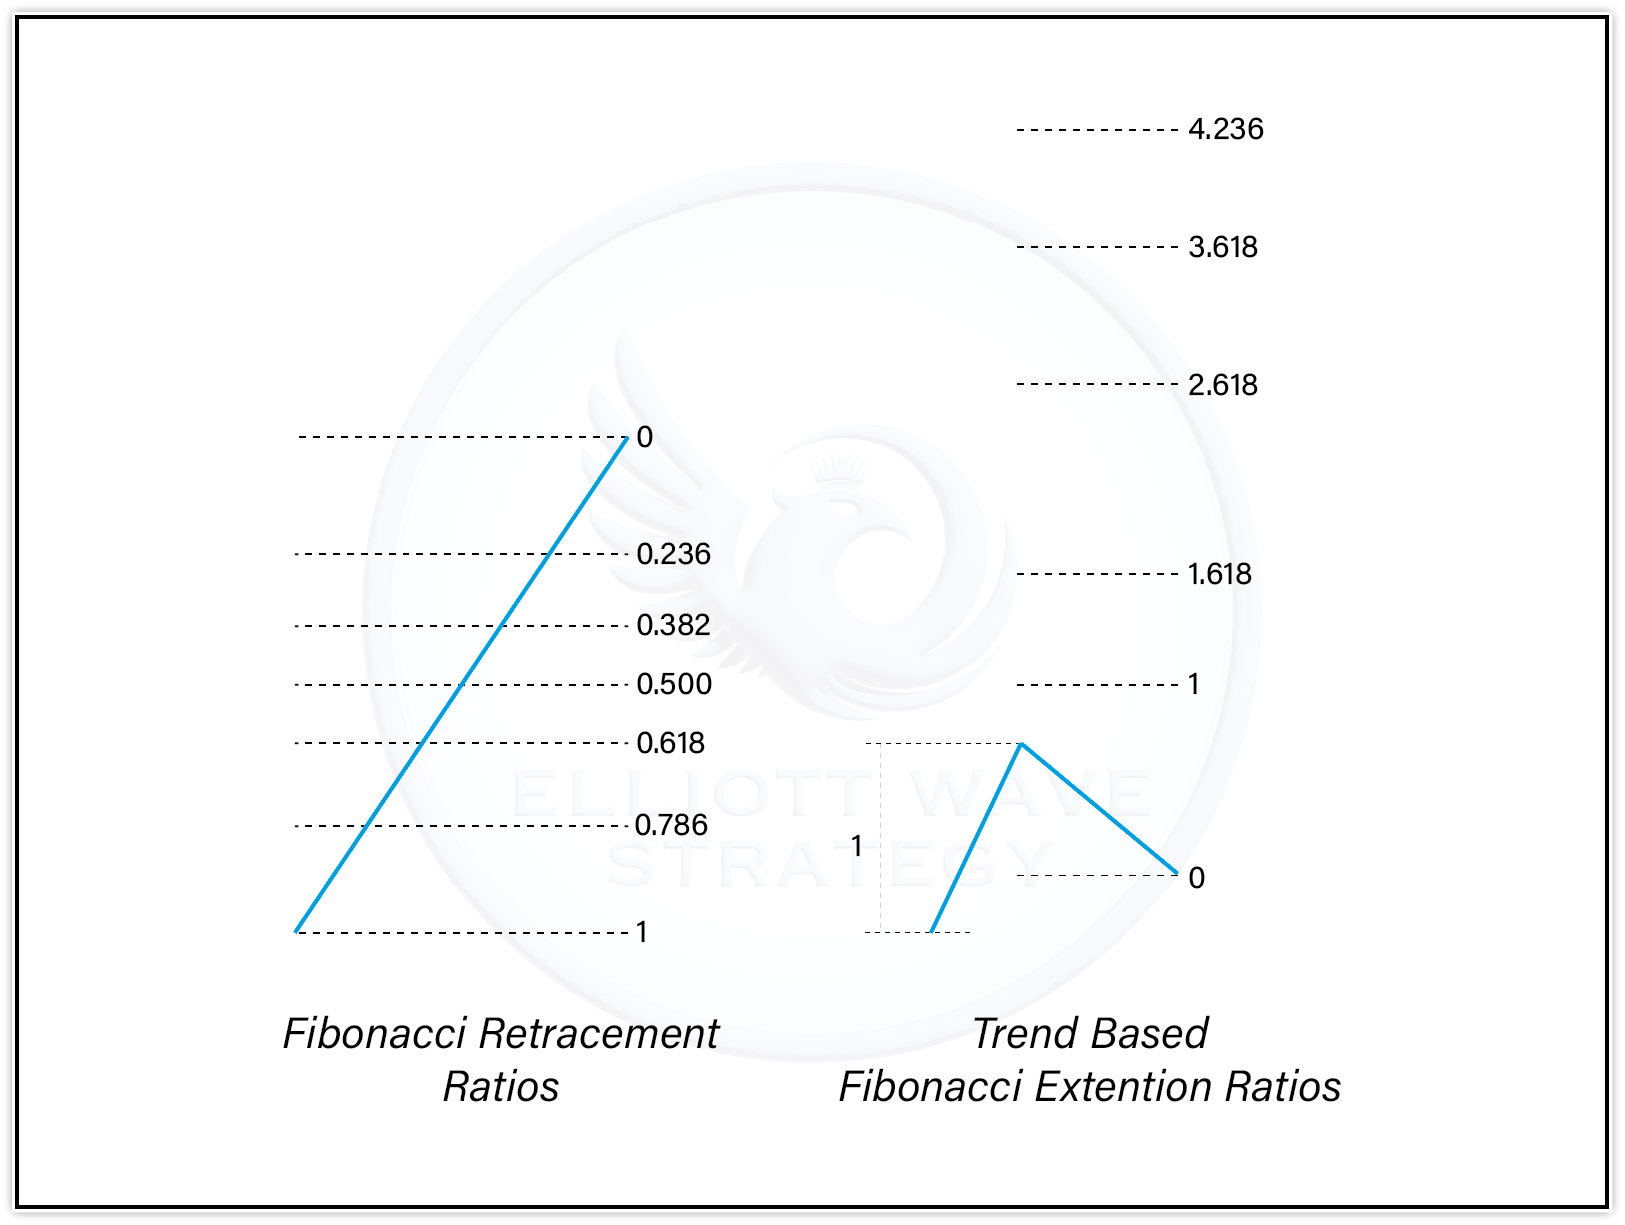
The Fibonacci sequence (1, 1, 2, 3, 5, 8, 13, 21, 34, 55, 89...) produces ratios that appear throughout nature and financial markets. The key ratios: 0.236, 0.382, 0.500, 0.618, 0.786 (retracements) and 1.000, 1.272, 1.618, 2.000, 2.618 (extensions).
In wave counting, these ratios define typical wave relationships: Wave 2 retracements (most common: 61.8% of Wave 1); Wave 3 extensions (most common: 161.8% of Wave 1); Wave 4 retracements (most common: 38.2% of Wave 3); Wave 5 length (most common: equal to Wave 1, or 61.8% of Waves 1 through 3).
How Fibonacci Supports Elliott Wave
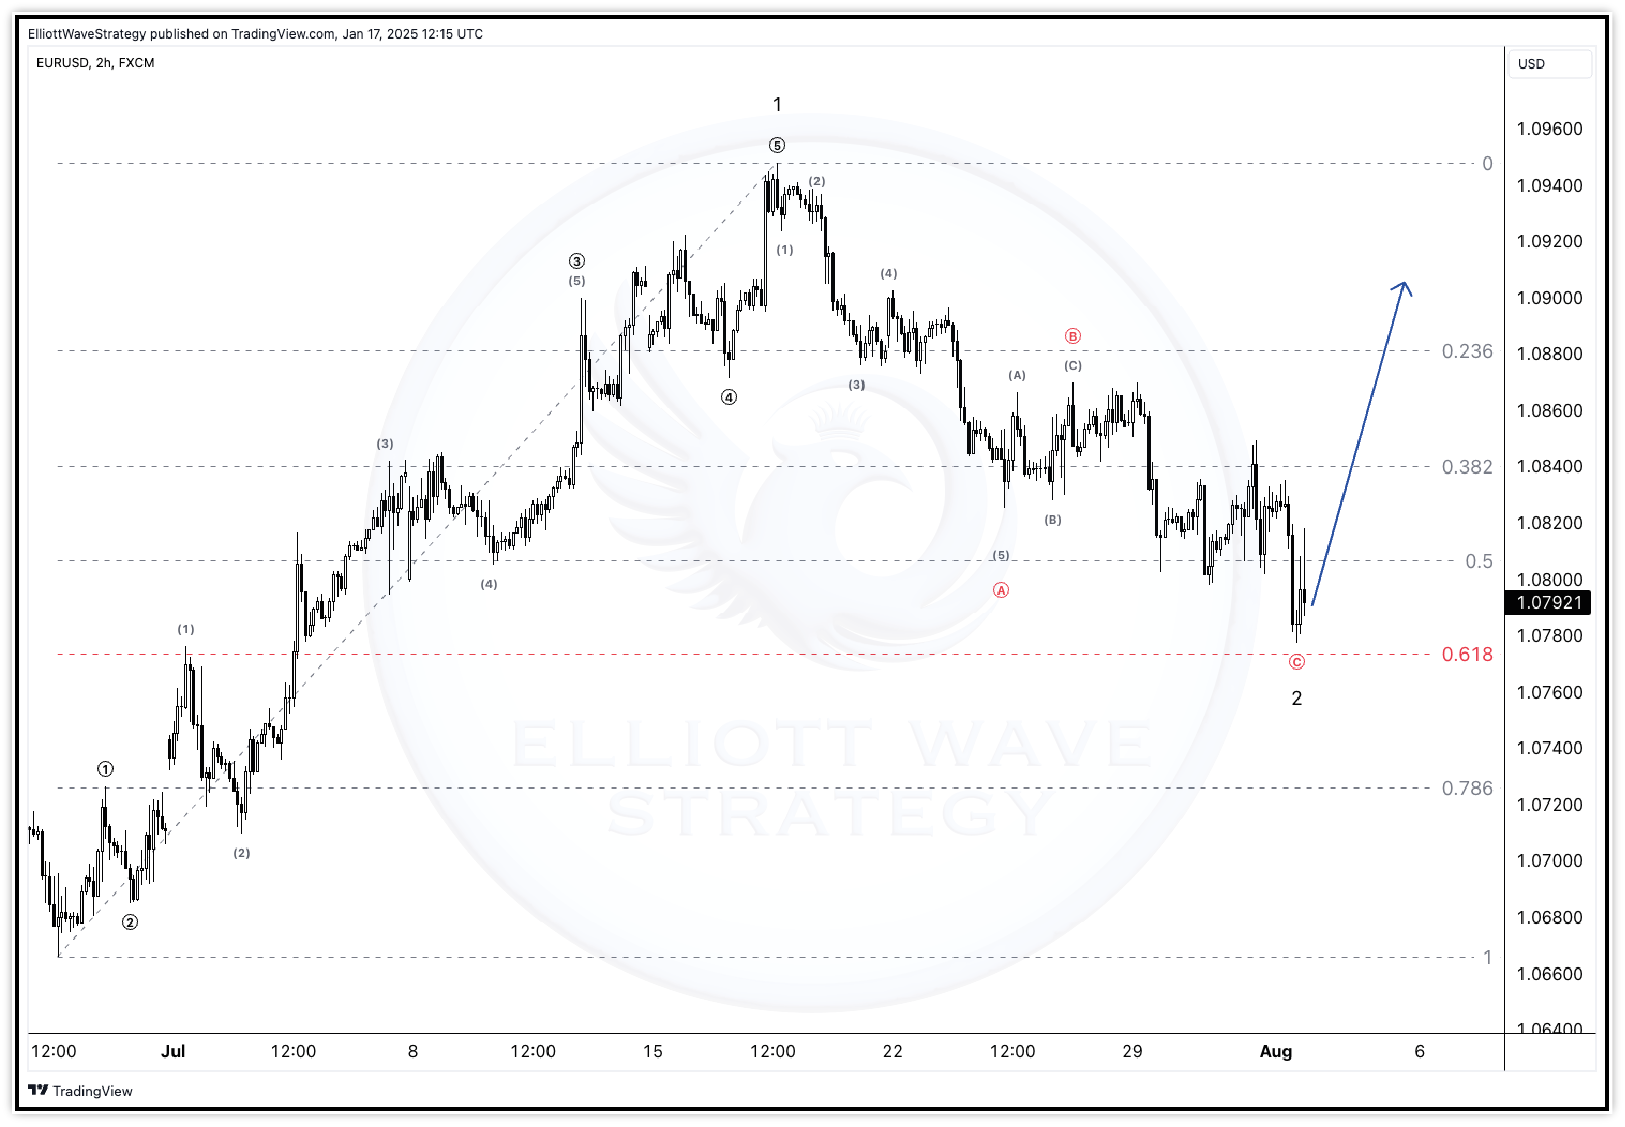
Fibonacci ratios support Elliott Wave analysis in two fundamental ways: they confirm wave counts and they provide price targets. When a corrective wave retraces to exactly 61.8% of the prior impulse wave, this Fibonacci confluence confirms the wave count and provides a high-probability entry point.
When a wave extends to exactly 161.8% of the prior wave-at the same time as other technical signals align-this Fibonacci extension level provides a reliable profit target. The more Fibonacci levels that cluster at a single price point, the stronger that level as support or resistance.
Key Fibonacci Ratios in Practice
The most important ratios for wave traders: 61.8% (the Golden Ratio)-most common retracement for Wave 2. 38.2%-most common retracement for Wave 4. 161.8%-most common extension target for Wave 3. 100%-Wave 5 commonly equals Wave 1; Wave C commonly equals Wave A. 261.8%-extended Wave 3 target when momentum is exceptionally powerful.
Practical application: After identifying a completed Wave 1, apply Fibonacci retracement to find the most likely Wave 2 endpoint (61.8% level), then apply Fibonacci extension from the Wave 1 high through the Wave 2 low to project the Wave 3 target (161.8% level).
Predicting Waves with Fibonacci
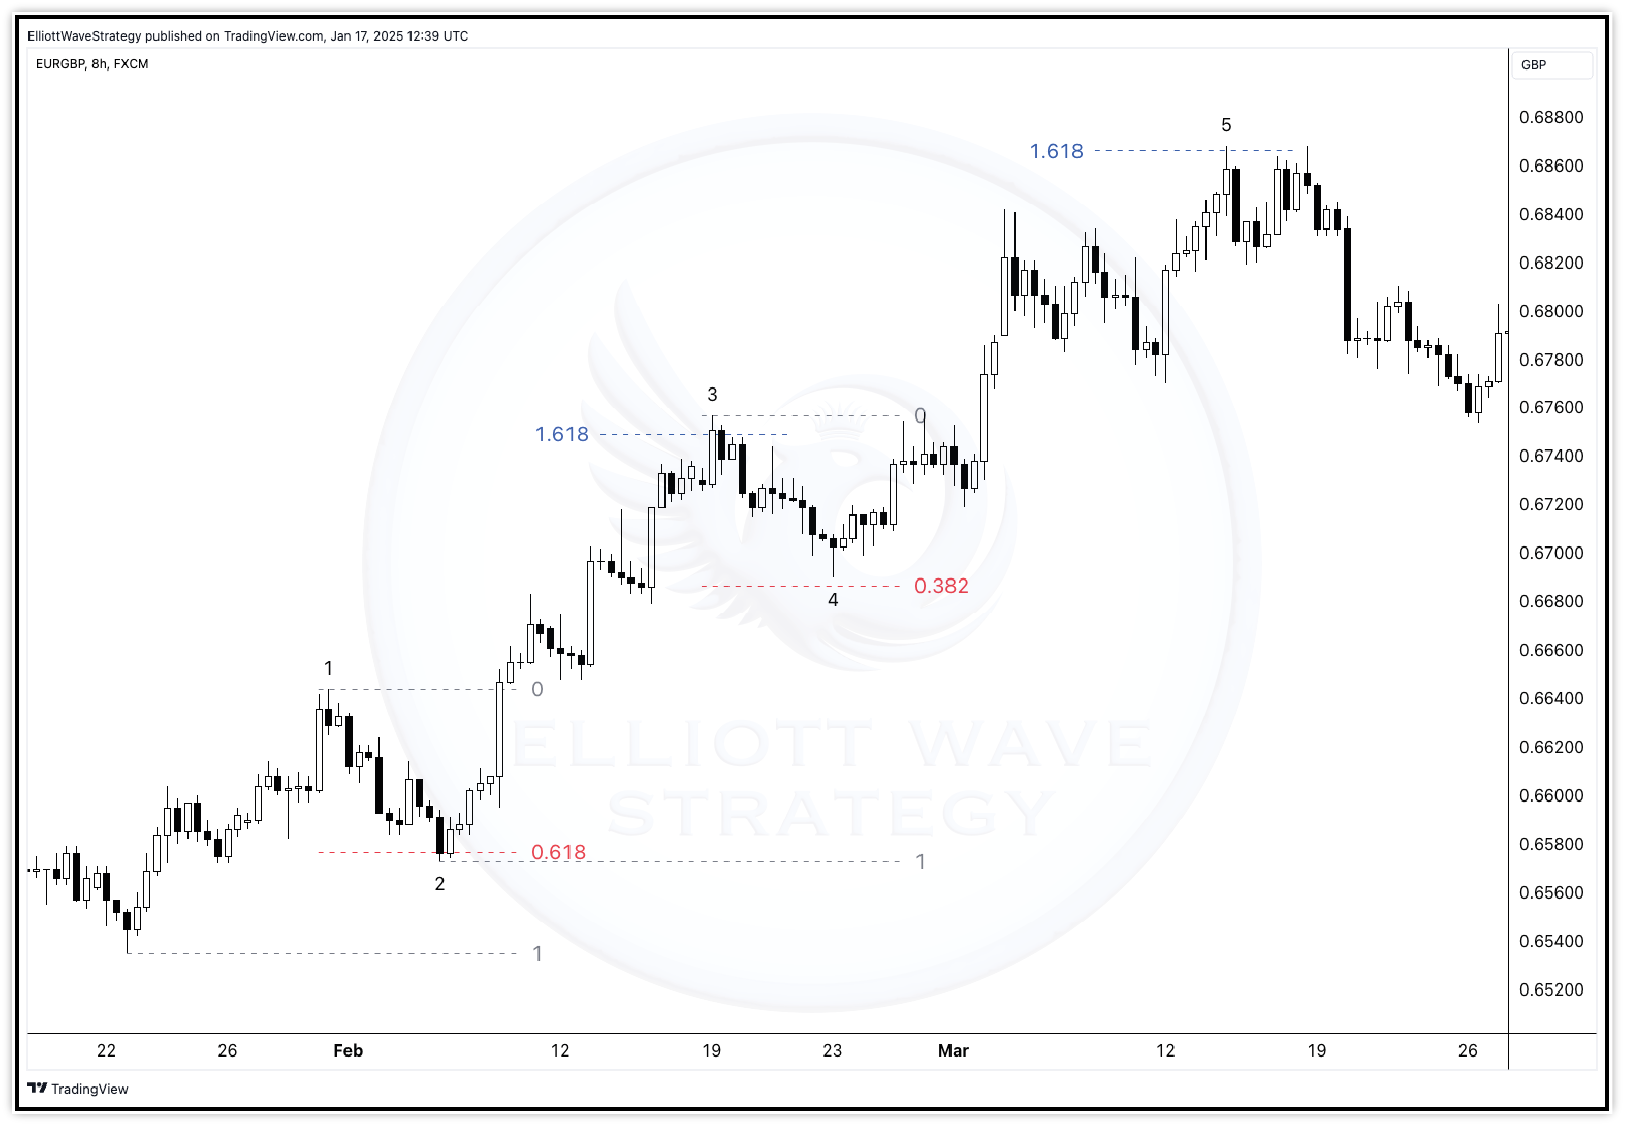
The power of Fibonacci in wave analysis is its ability to predict future price levels before they are reached. Once a Wave 1 completes, a trader can calculate: the most likely Wave 2 endpoint (61.8% retracement); the most likely Wave 3 target (161.8% extension); the most likely Wave 4 retracement (38.2% of Wave 3); the most likely Wave 5 target (equal to Wave 1 from Wave 4 low).
These pre-calculated levels allow traders to place limit orders at Fibonacci targets, set stop-losses at the next significant Fibonacci level, and plan partial profit-taking at each successive target-all before the wave sequence even begins.
Combining Fibonacci with Elliott Wave
The most powerful setups arise when Fibonacci ratios from multiple wave degrees converge at the same price level. For example: a 61.8% retracement of Wave 1 (minor degree) aligns with a 38.2% retracement of the prior larger degree wave. This ‘Fibonacci confluence’ creates a high-probability support or resistance zone.
Always look for at least two Fibonacci levels converging at the same price before committing to an entry. Three or more converging levels create extremely high-probability trade setups.
Extensions for Trading
Fibonacci extensions project how far impulse waves will travel. The standard method: identify the start of Wave 1 (point 0), the end of Wave 1 (point 1), and the end of Wave 2 (point 2). Apply the extension tool from point 0 to point 1 to point 2. The resulting levels (127.2%, 161.8%, 200%, 261.8%) project potential endpoints for Wave 3.
For Wave 5 projections: measure the distance from the start of Wave 1 to the end of Wave 3, then add this to the end of Wave 4. Wave 5 most commonly equals Wave 1 in length.
How Accurate Are Fibonacci Ratios?
Fibonacci ratios in Elliott Wave are zones of probability-areas where wave completions are more likely than others. The 61.8% retracement is not a guarantee that Wave 2 will reverse exactly there; it means reversals cluster more frequently around this level.
Accuracy improves when: Multiple Fibonacci levels converge; Fibonacci levels align with other technical support/resistance; Wave counts are unambiguous; Volume and momentum indicators confirm the wave.
The Golden Ratio Connection
The Golden Ratio (φ = 1.618...) is the mathematical foundation of Fibonacci analysis. It appears throughout nature-in the spiral of a nautilus shell, the arrangement of sunflower seeds, the branching of trees-and Elliott believed it was embedded in human social behavior.
Every ratio used in Elliott Wave analysis is derived from the Golden Ratio: 0.618 = 1/φ; 0.382 = 1 - 0.618; 1.618 = φ; 2.618 = φ². This mathematical elegance is why Fibonacci ratios work consistently across different markets, timeframes, and historical periods.
Fibonacci in Corrective Waves
Corrective waves follow Fibonacci relationships just as reliably as impulse waves. In a zigzag: Wave C most commonly equals Wave A (100%); Wave B retraces 38.2%–61.8% of Wave A. In a flat: Wave C most commonly equals 100% of Wave A; Wave B retraces approximately 100% of Wave A.
In a triangle: each successive wave typically retraces 61.8% of the prior wave, creating a converging pattern. These ratios help traders anticipate the endpoints of corrective structures and time entries for the subsequent impulse wave.
Conclusion
Fibonacci ratios are not an add-on to Elliott Wave Theory-they are fundamental to it. The ability to pre-calculate wave targets using Fibonacci measurements transforms Elliott Wave analysis from a descriptive tool into a predictive one.
At EW Strategy, every wave count includes Fibonacci-derived targets for anticipated Wave 3 and Wave 5 moves, as well as clear invalidation levels based on Fibonacci retracement rules. This precision allows traders to trade with defined risk and clear objectives.