
Identifying Wave Patterns
One of the most important skills in Elliott Wave analysis is the ability to identify wave patterns as they form in real time. Understanding the structural differences between impulse and corrective waves-and knowing what to look for at each stage-separates profitable wave traders from those who struggle with endless relabeling.
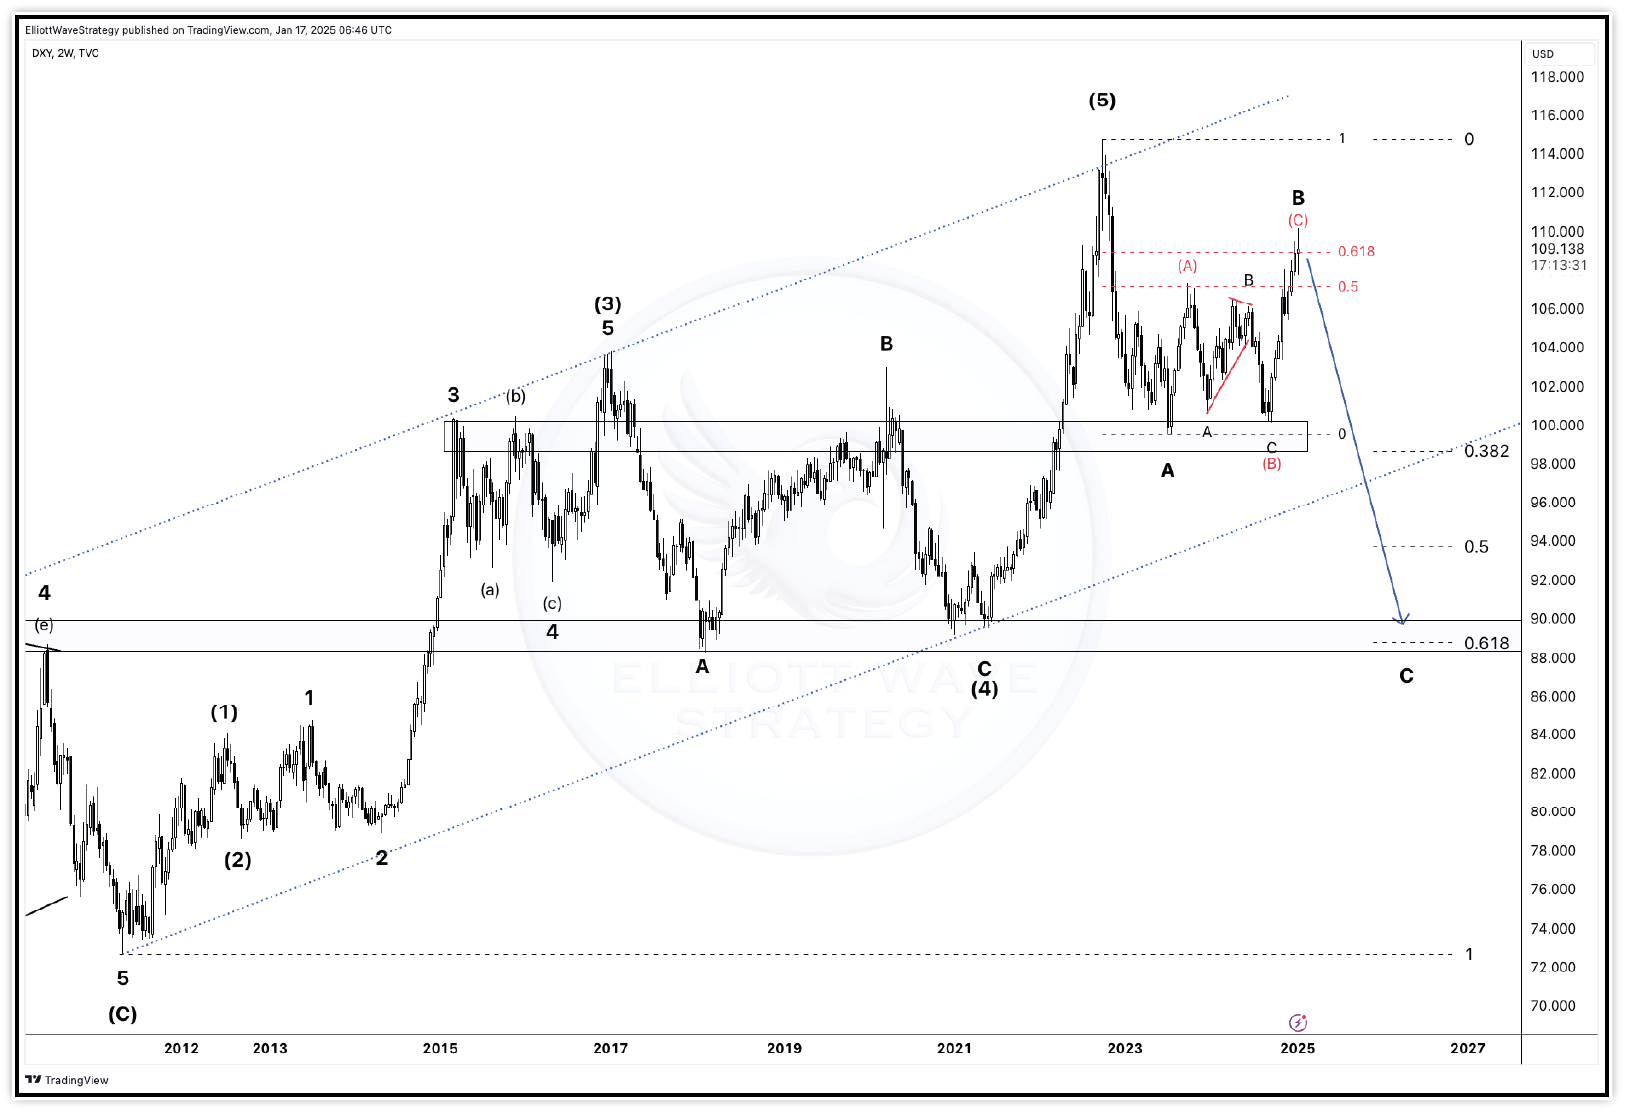
Understanding Wave Patterns
Wave patterns in Elliott Wave Theory are the visual fingerprints of market psychology. Each pattern-whether an impulse, zigzag, flat, or triangle-reflects a specific sequence of crowd behavior. Impulse waves show trending behavior; corrective waves show consolidation or counter-trend behavior.
Every wave pattern has a specific structure, specific rules it must obey, and specific guidelines about its typical characteristics. Learning to distinguish between these patterns-and to identify them while they are still forming-is the core skill of Elliott Wave trading.
How to Spot Wave Patterns
Spotting wave patterns requires a systematic approach. Start on higher timeframes (daily or weekly) to identify the dominant trend and the larger wave degree. Then drop to lower timeframes to refine entry points within that larger structure.
Look for: five-wave sequences in the direction of the trend (impulse waves); three-wave sequences against the trend (corrective waves); Fibonacci relationships between waves; volume patterns (typically highest in Wave 3, diminishing in Wave 5).
Recognizing Impulse vs. Corrective
The fundamental distinction in Elliott Wave analysis is between impulse waves (five-wave structures moving with the trend) and corrective waves (three-wave structures moving against the trend). Impulse waves have strong directional movement, no wave overlap between waves 1 and 4, and clear momentum.
Key distinguishing features: Impulse waves subdivide as 5-3-5-3-5; Corrective zigzags subdivide as 5-3-5; Corrective flats subdivide as 3-3-5; Corrective triangles subdivide as 3-3-3-3-3. Wave 4 of an impulse cannot overlap Wave 1’s price territory-this is the most reliable rule for confirming an impulse count.
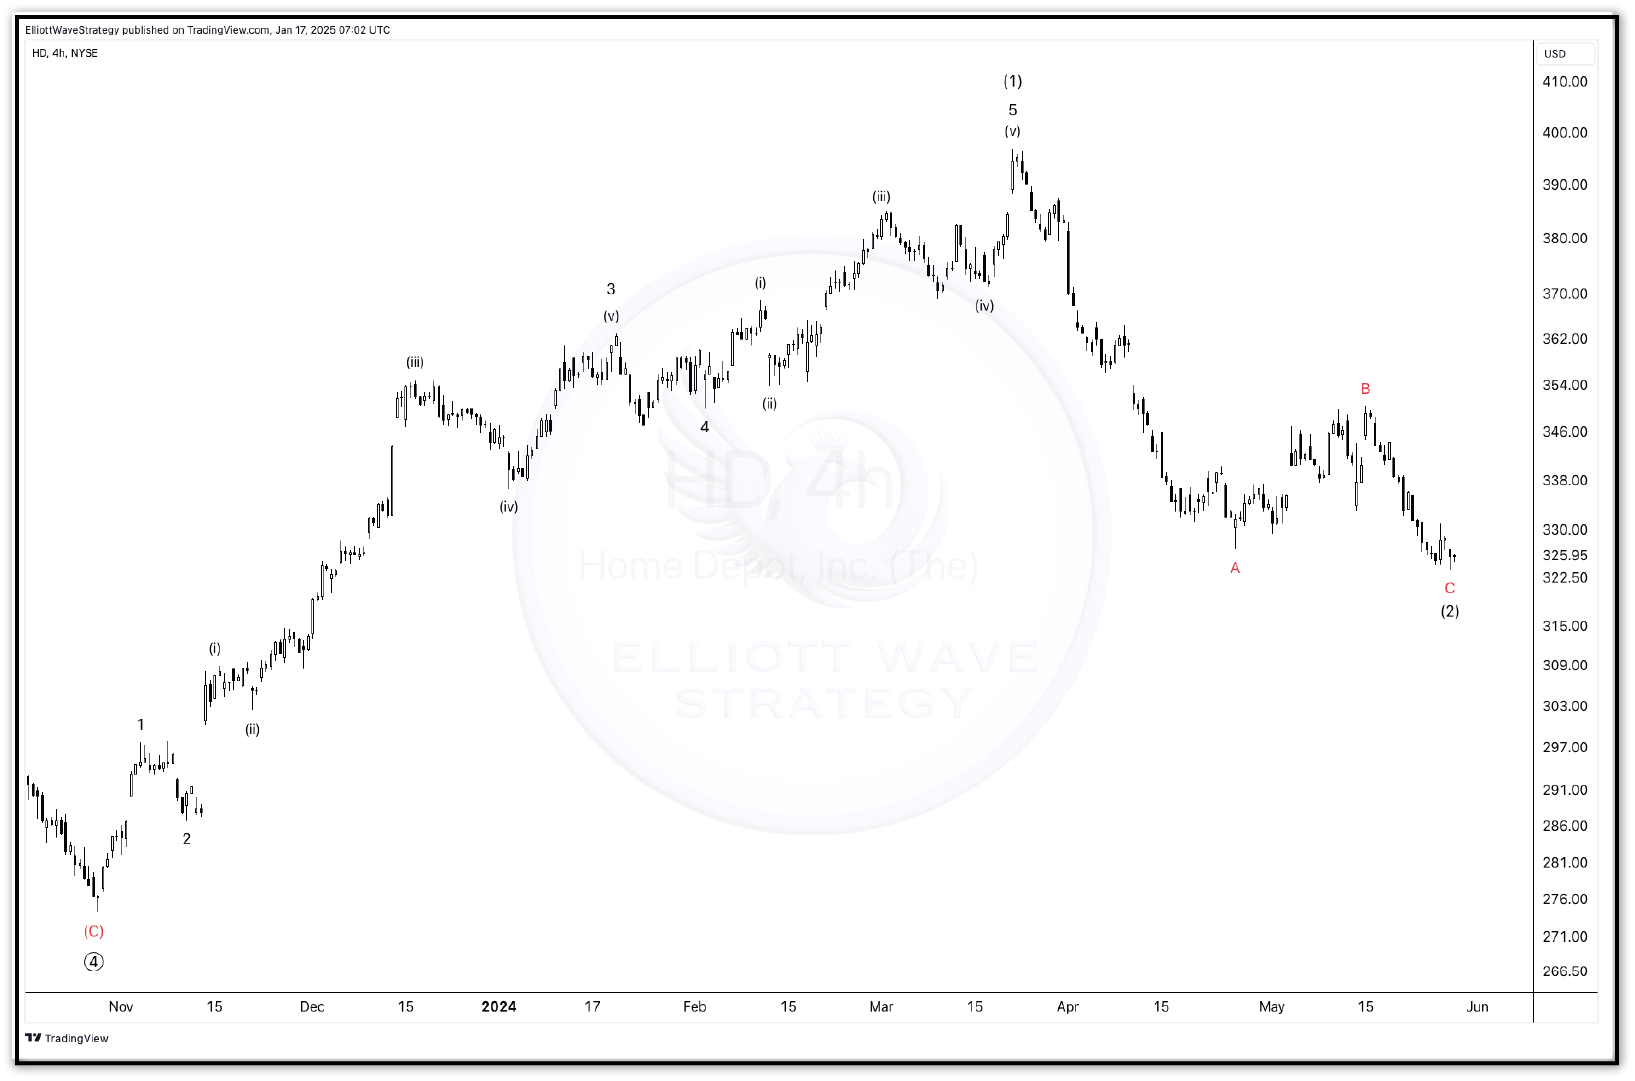
Wave Pattern Rules
Strict rules define valid wave patterns. For impulse waves: Wave 2 never retraces more than 100% of Wave 1; Wave 3 is never the shortest of Waves 1, 3, and 5; Wave 4 never enters Wave 1’s price territory.
For zigzag corrections: Wave A and Wave C both subdivide into five waves; Wave B retraces between 38.2% and 78.6% of Wave A. For flat corrections: Wave B retraces at least 90% of Wave A; Wave C terminates near or beyond Wave A’s endpoint. For triangles: All five sub-waves (A-B-C-D-E) subdivide into three waves bounded by two converging trendlines.
Visual Guide to Wave Patterns
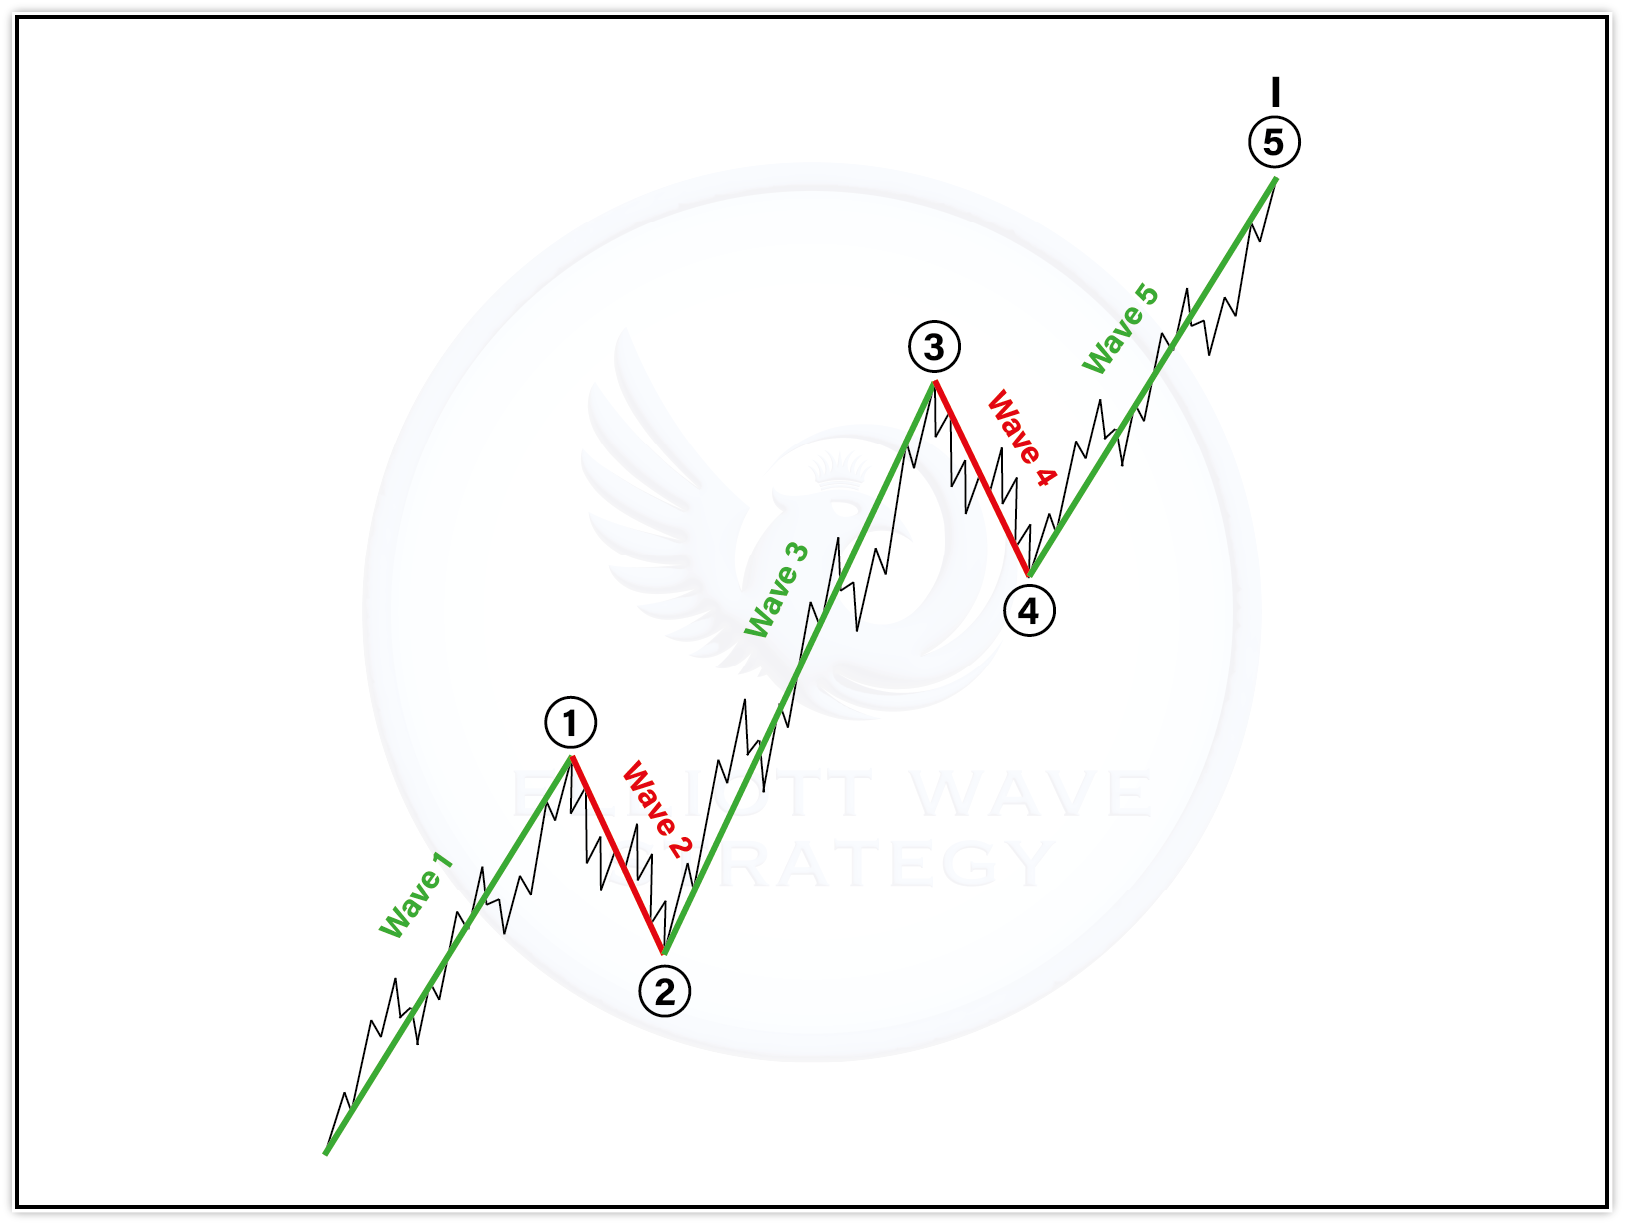
A typical impulse wave shows a five-wave advancing structure with Wave 3 as the longest and strongest wave. Wave 2 often retraces to around the 61.8% Fibonacci level of Wave 1. Wave 4 often retraces to around the 38.2% Fibonacci level of Wave 3. Wave 5 often equals Wave 1 in length.
When viewing an impulse on a chart, look for: an initial strong move (Wave 1); a pullback to approximately 50%–62% (Wave 2); the longest and strongest advance (Wave 3); a mild sideways pullback (Wave 4); a final push that may show RSI divergence (Wave 5).
Corrective Wave Visual Guide
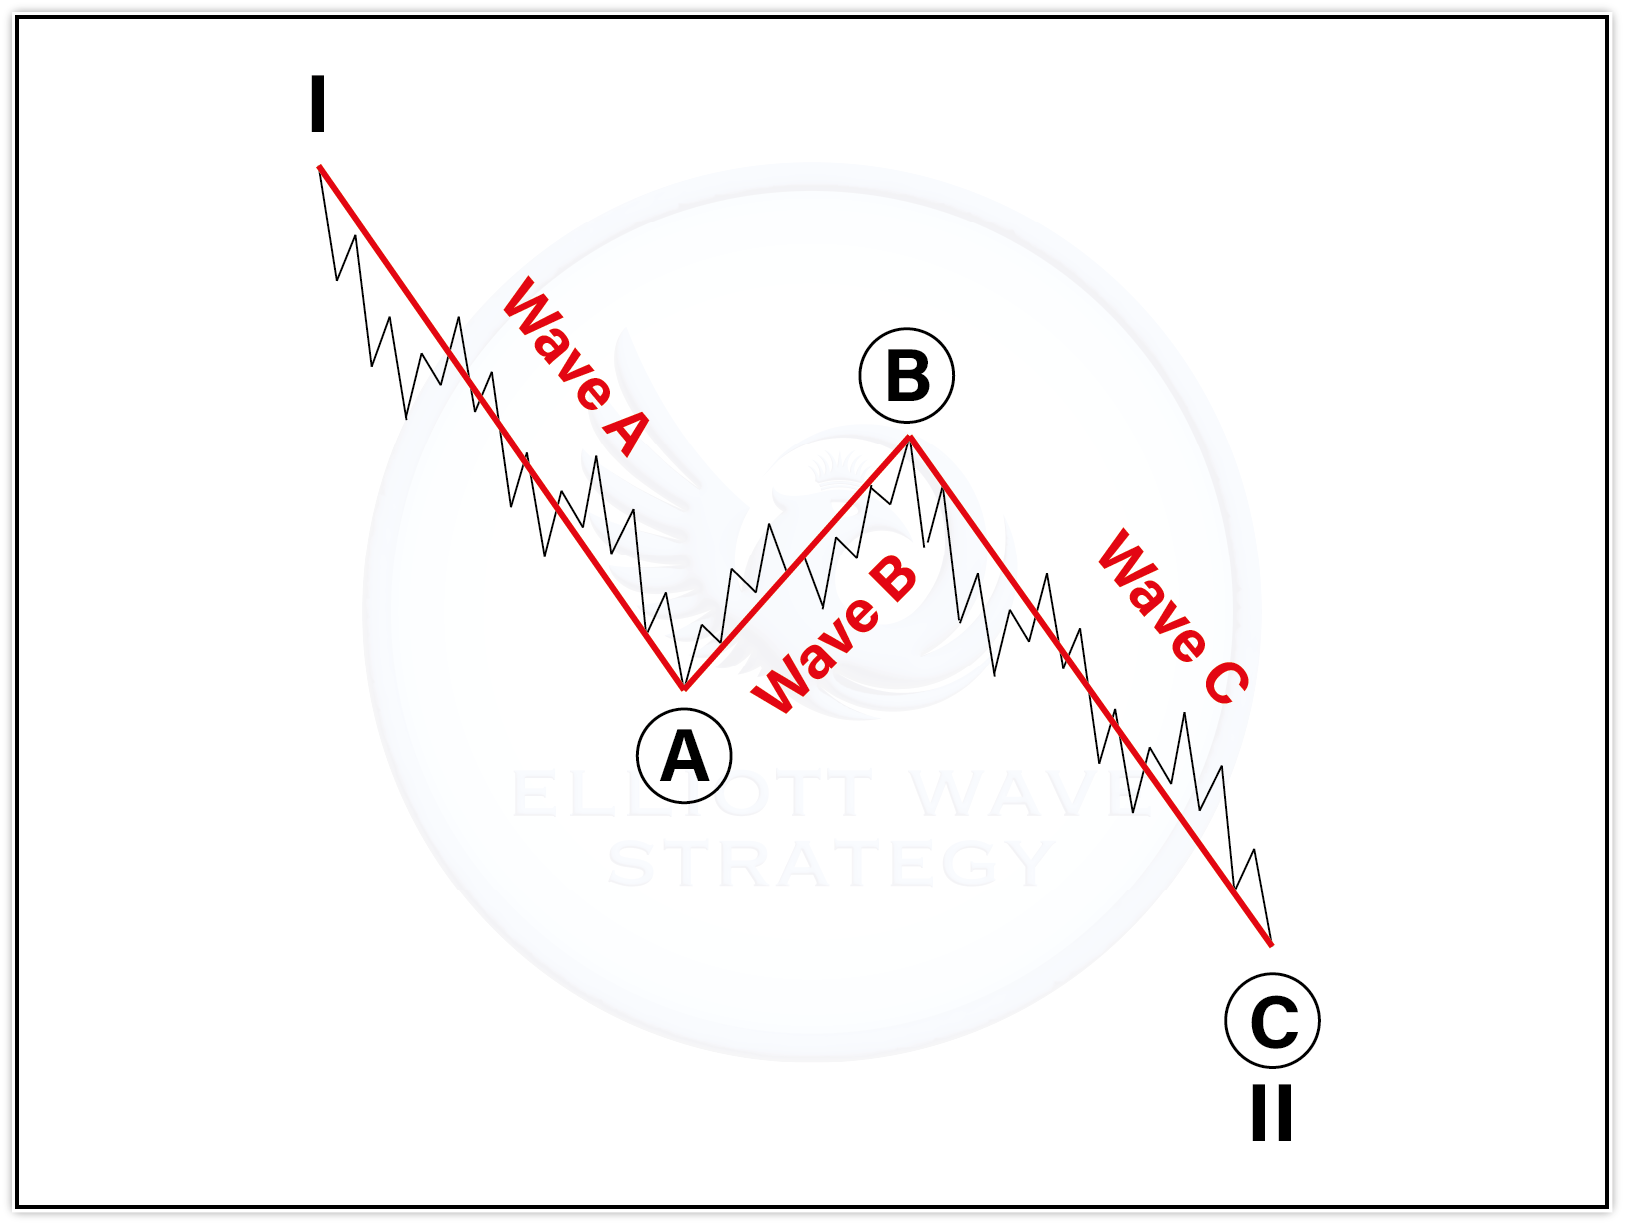
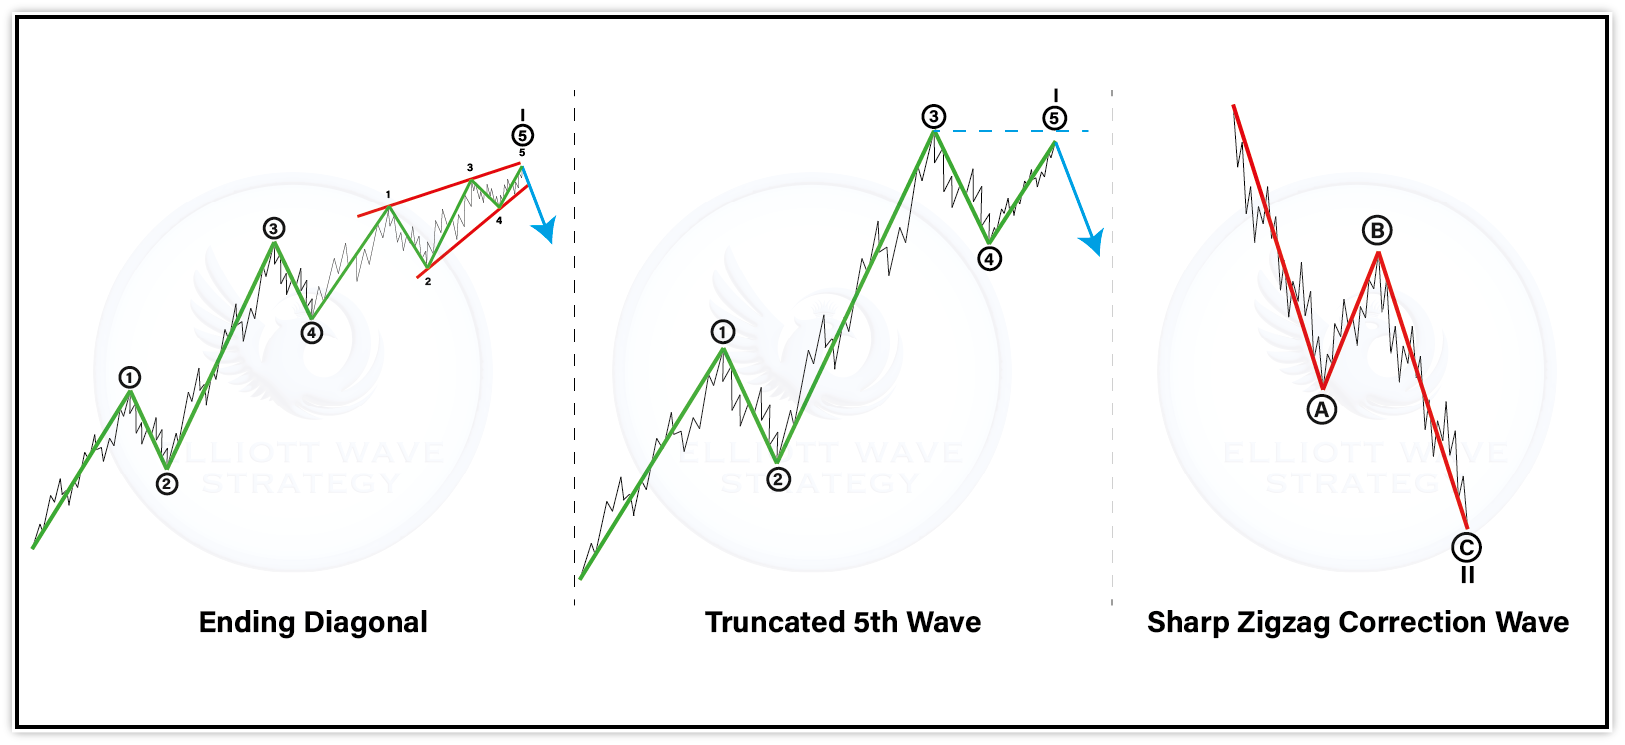
Corrective waves are more diverse and complex than impulse waves. The three main corrective patterns are: Zigzag (sharp, deep correction-most common for Wave 2); Flat (sideways correction-most common for Wave 4); Triangle (contracting or expanding-most common for Wave 4 or Wave B).
Each has a distinct visual signature. Zigzags look like a sharp A-down, B-up-partial, C-down sequence. Flats look more symmetrical with the B wave recovering most of the A wave. Triangles show five overlapping waves that converge toward an apex.
Spotting Reversal Patterns
Some of the most powerful trading signals come from reversal patterns: Ending diagonals (wedge patterns at the end of Wave 5 or Wave C); Truncated Wave 5 (Wave 5 fails to exceed Wave 3, signaling exhaustion); RSI divergence at wave extremes; Volume climax at the end of Wave 3 or Wave 5.
When an ending diagonal completes, the subsequent reversal often retraces the entire diagonal rapidly-providing an excellent risk/reward trade opportunity.
Tools for Analyzing Wave Patterns
Several tools enhance Elliott Wave pattern identification: Fibonacci Retracement Tool-for measuring likely endpoints of corrective waves; Fibonacci Extension Tool-for projecting targets for impulse waves; Trend Channel Tool-for containing wave sequences within parallel channels.
RSI identifies divergences at wave extremes. Volume confirms wave strength (high volume in Wave 3, low in Wave 5). Some charting platforms offer auto wave labeling, though human oversight remains essential.
Pattern Identification Checklist
Before committing to a wave count, run through this checklist: Does the impulse have five clearly identifiable waves? Does Wave 3 appear to be the strongest and longest? Are the Fibonacci relationships consistent? Does Wave 4 avoid overlapping Wave 1’s price territory? Is there RSI divergence at the expected wave terminus?
Does the corrective pattern subdivide correctly (3 or 5 waves as expected)? Are there alternative wave counts that must be monitored? A systematic approach brings discipline and helps avoid emotional trading decisions.
Avoiding Common Errors
The most common mistakes: Forcing a five-wave count where only three waves exist; Ignoring wave overlap rules (particularly Wave 4 into Wave 1 territory); Relabeling every time price moves against the expected count; Using Elliott Wave in isolation without confirming indicators; Failing to maintain an alternative wave count.
Always remember: if a cardinal rule is broken, the count is wrong-not the rule. By blending diligence with flexibility, you can significantly reduce miscounts that lead to misguided trades.
Conclusion
Identifying wave patterns accurately is a skill built through practice and pattern recognition. The key is to understand both the rules that must be obeyed and the typical characteristics that help identify each pattern type.
Start with higher timeframes, confirm Fibonacci relationships, use RSI divergence as confirmation, and always maintain an alternative count. With time, these patterns become second nature-and the market’s seemingly random movements begin to reveal their underlying structure.