
Trading Trends with Elliott Waves
Elliott Wave Theory is ultimately a trading tool-and its highest application is identifying and trading the dominant market trend. By understanding where the market is within its larger wave structure, traders can align their positions with the path of least resistance, enter with defined risk, and hold through corrections with confidence.
Identifying the Dominant Trend
Start with the monthly or weekly chart and determine whether the market is in a large-degree impulse (trending) or correction (consolidating). If the higher timeframe shows a clear five-wave impulse in progress, the dominant trend is intact and you should trade in that direction on lower timeframes.
Key principle: you are always trading at a lower degree in the direction of the higher-degree impulse. If the weekly chart is in Wave 3, then daily corrections are buying opportunities, not reversal signals.
Determining Your Wave Position
Before entering any trade, determine where you are at multiple timeframes: Higher timeframe (weekly/monthly)-which wave of the larger degree is in progress? Medium timeframe (daily)-which sub-wave is forming? Lower timeframe (H4/H1)-which sub-wave of the daily wave is active?
The ideal setup: the higher timeframe is in Wave 3; the medium timeframe has just completed a Wave 2 or 4 pullback; the lower timeframe shows a five-wave impulse completing the correction, signaling trend resumption.
Trend Entry Strategy
The most reliable trend entry: Wait for a five-wave impulse to complete (Wave 1). Wait for a three-wave correction (Wave 2). Enter at the 50%–61.8% Fibonacci retracement with a stop below Wave 1’s origin. Target: 161.8% extension (Wave 3).
This provides a minimum risk/reward ratio of approximately 1:3-risking the move from entry to stop to capture the 161.8% Wave 3 extension. In trending markets, multiple such setups occur within the larger wave sequence.
Riding Wave 3, The Most Powerful Move
Wave 3 characteristics: Strongest momentum (highest RSI, expanding volume); largest price coverage; most sub-waves clearly identifiable; often extends to 161.8%–261.8% of Wave 1.
Strategy: Enter at the Wave 2 completion. Add on minor pullbacks within Wave 3. Hold through volatility-Wave 3 will have internal corrections. Take partial profits at 161.8%; hold the remainder for 200% or 261.8% if Wave 3 appears extended.
Stop-Loss and Risk Management
Elliott Wave provides the most logical stop-loss placement: Wave 2 trade stop-just below the origin of Wave 1. Wave 4 trade stop-just below the end of Wave 1 (cannot overlap). Post-correction entry stop-just below the correction low.
Position sizing: risk no more than 1%–2% of trading capital on any single trade. Calculate position size based on the distance from entry to stop-loss, then size the position so this distance equals your maximum risk amount.
Multi-Timeframe Analysis
Combine analysis across timeframes: Weekly chart establishes the dominant wave degree. Daily chart identifies sub-wave structure and current position. H4 chart times the entry by identifying corrective completion. H1 chart fine-tunes entry by watching for the first five-wave impulse.
When weekly, daily, and H4 charts all point to the same conclusion, the probability of a successful trade increases dramatically.
Exiting at Wave 5 Completion
Wave 5 completion signals: RSI divergence-price makes a new high but RSI makes a lower high. Volume divergence-Wave 5 on lower volume than Wave 3. Truncation-Wave 5 fails to exceed Wave 3’s high. Ending diagonal-a wedge pattern forms in Wave 5.
Exit strategy: take partial profits at the Wave 5 target (equal to Wave 1 from Wave 4 low). Exit remaining on the first reversal signal. Move stop to break-even after Wave 5 is clearly underway.
Managing Corrections Within Trends
A correction is normal and healthy if: Wave 2 stays above the Wave 1 origin; Wave 4 stays above Wave 1’s high; the correction shows a three-wave structure (not five-which would suggest a trend reversal).
If a correction violates impulse rules (Wave 2 below Wave 1 origin, or Wave 4 below Wave 1 high), exit the position-the wave count has been invalidated and the market may not be in the trend you thought.
Real-World Example: Bitcoin Trend
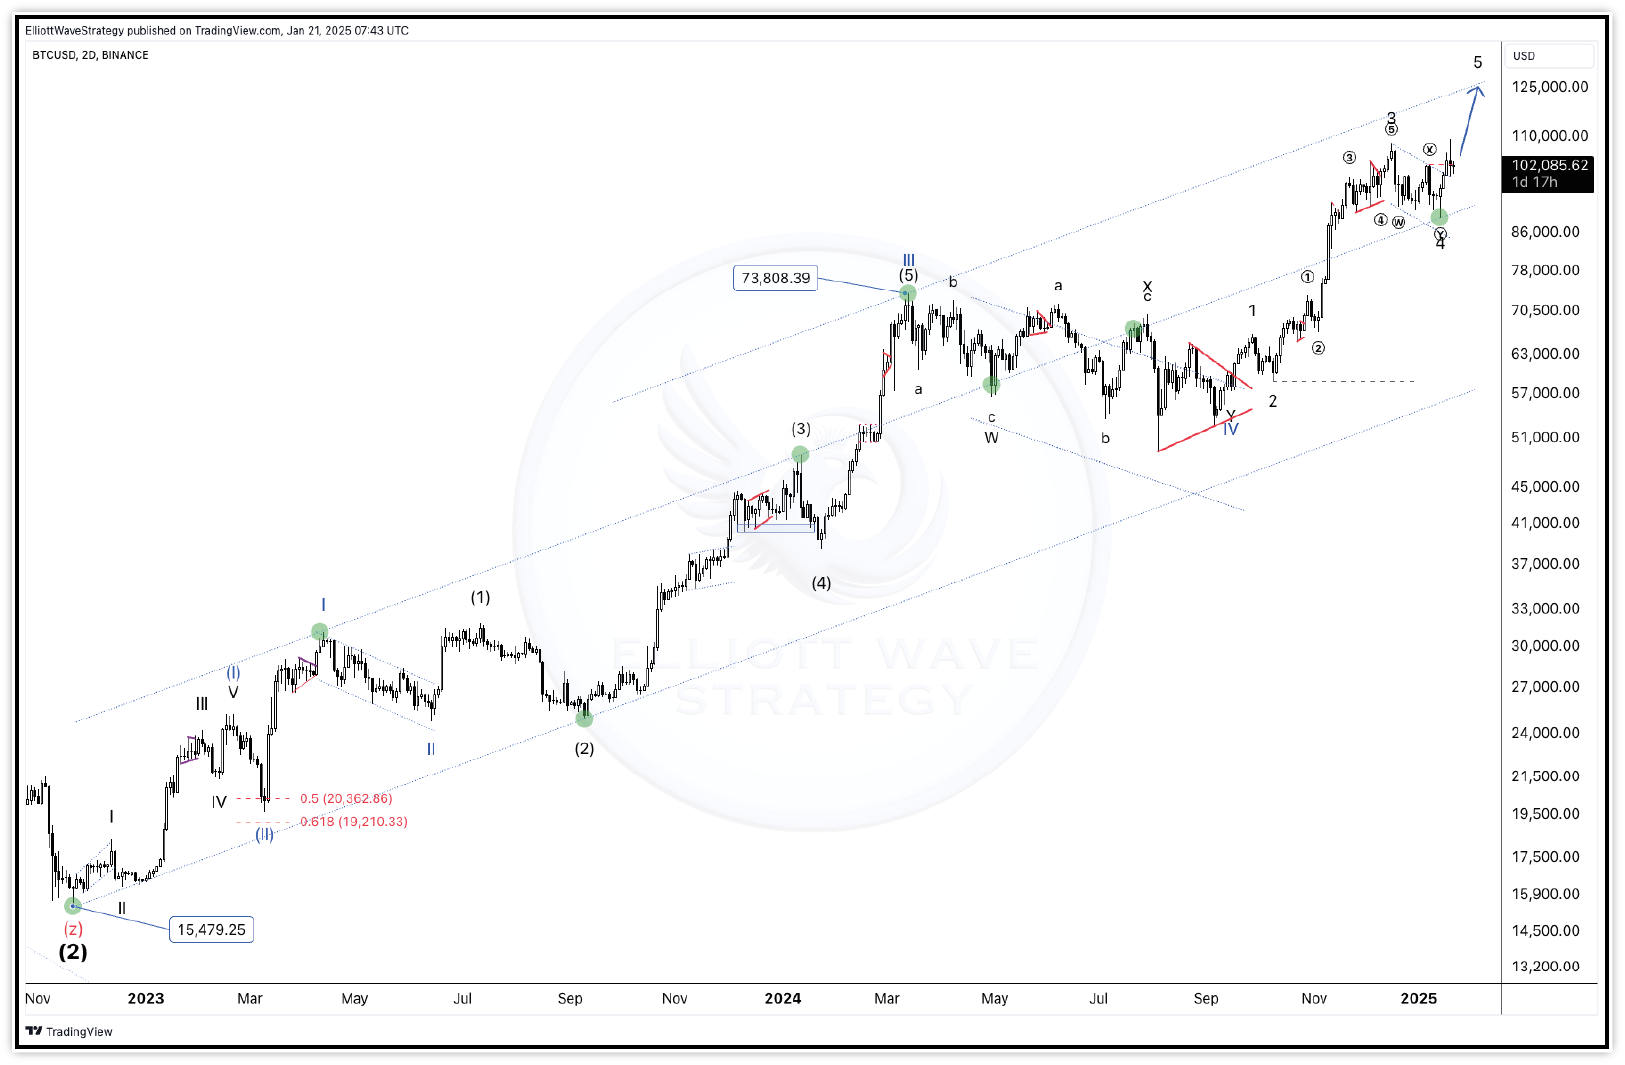
The Bitcoin market provides excellent Elliott Wave examples due to its clear trending behavior and large-amplitude waves. Major bull markets have consistently displayed textbook five-wave impulse structures, with Wave 3 extending to 261.8%–423.6% of Wave 1.
Corrective phases between bull markets have shown clear A-B-C structures, with Wave C extending to equal Wave A. Traders who identified Wave 2 and Wave 4 corrections-and entered at Fibonacci support-captured some of the most profitable trades in modern financial history.
Combining Elliott Wave with Other Tools
For maximum effectiveness: RSI confirms momentum at wave extremes; divergence at Wave 5 warns of exhaustion. Volume-expanding in Waves 1 and 3 confirms the trend; diminishing in Wave 5 warns of exhaustion. Moving Averages-price staying above key EMAs confirms the trend during corrections.
Fibonacci confirms wave endpoints; confluence of multiple levels dramatically improves probability. The combination of Elliott Wave structure with confirming indicators creates a complete, systematic trading approach.
Conclusion
Trading trends with Elliott Waves is about aligning your position with the path of least resistance at the dominant degree, and entering at the highest-probability points within that trend.
By combining higher-timeframe wave identification with lower-timeframe entry timing, Fibonacci-derived targets, and rule-based stop placement, Elliott Wave trend trading offers a complete, systematic approach to capturing the largest directional moves in any market.